
The business question Where are our project dependencies? provides a high-level view of relationships between projects and programs, helping users understand how initiatives influence one another through Time, Architecture, and Resource dependencies. It also highlights architecture elements that are impacted by multiple projects, enabling organizations to identify potential conflicts, overlaps, and coordination requirements at an early stage.
By providing transparency into project interdependencies, this business question supports informed prioritization and funding decisions. Dependencies can be analyzed across projects and programs to facilitate collaboration between stakeholders, identify potential risks before project approval, and ensure that scheduling, resource allocation, and architectural impacts are considered throughout the planning process.
The license package IT Transformation Server - Enterprise is required to work with this business question.
Navigate to Where are our project dependencies?
Use the method that is most convenient for you:
- In the left navigation panel, enter Where are our project dependencies? in the Search Navigation field.
- In the left navigation panel, click Home. In the content area, go to the Business Questions page and click the tile for Where are our project dependencies?
- In the left navigation panel, expand the sections Business Questions and Transformation and click Where are our project dependencies?
What information is displayed in Where are our project dependencies?
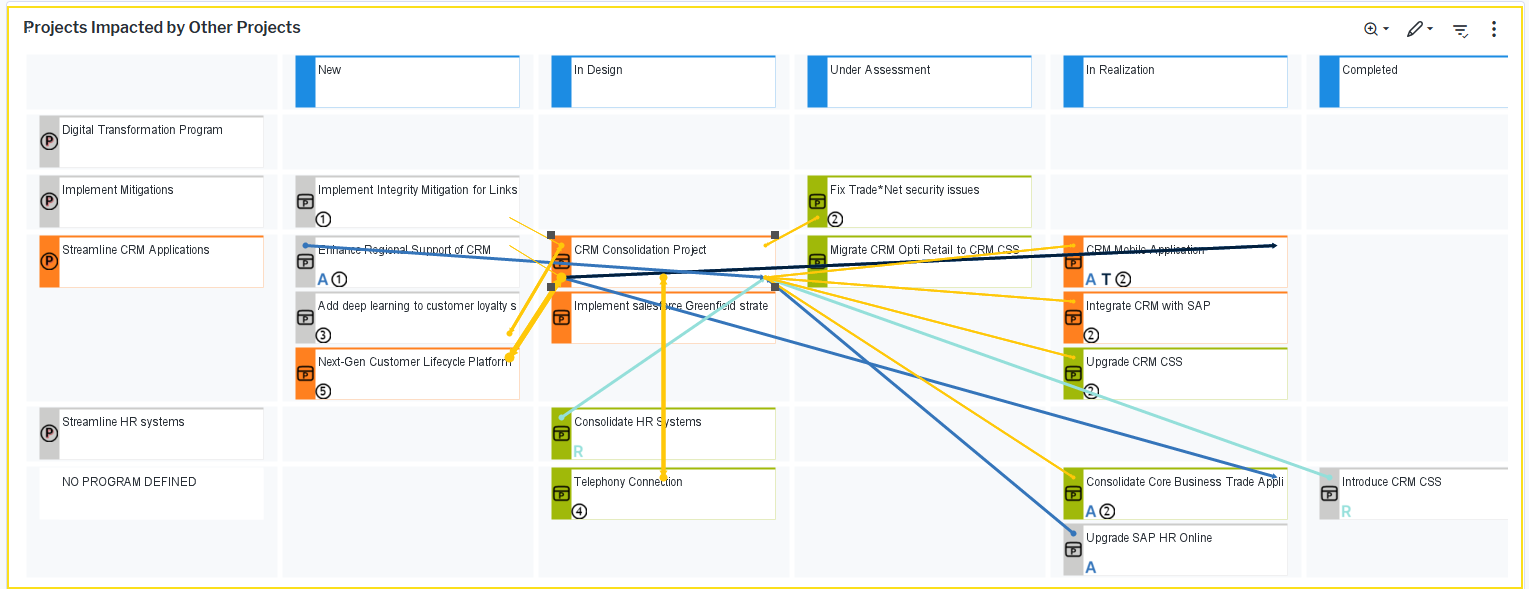
The Kanban-like matrix shows projects and how they impact other projects. Here's how to interpret the information:
- The first lane shows the programs that are the parent of the projects displayed in the matrix rows. A matrix element may be available in the first lane labelled No Program Defined. The corresponding row shows projects that are not assigned to a parent program.
- All other lanes represent the Status attribute defined for projects. Point to the header of a lane to view a tooltip explaining the value. The lanes represent the following values:
- New: The project has only mandatory data defined. A project with this status can be deleted.
- In Design: The project is being scoped and defined. A project with this status cannot be deleted.
- Under Assessment: The project is being evaluated for implementation. A project with this status cannot be deleted.
- In Realization: The project is being worked on. A project with this status cannot be deleted.
- Completed: The project has finished. A project with this status can be deleted.
- Rejected: The project is no longer valid and can be deleted.
- Only projects that match the criteria specified in the Status filter are displayed. Click the
 local filter button > Status to limit the projects displayed. All status lanes will continue to be displayed though to show dependency relationships.
- Drag a project to a different lane to change the value of the Status attribute.
- The projects in the matrix cells are colored based on the RAG (Red, Amber, Green) status value for each project. The RAG status is derived from the project monitoring indicators for Budget, Resource, and Time.
- The letters T, A, and R indicate the type of dependency a project will have. Only the dependency types selected in local filter button > Dependency Type will be displayed:
- T: Indicates a dependency between projects due to a Time issue. This means a project must be completed first before the next project can begin. A connection starts with a project and points to the project that is dependent on the source of the dependency.
- A: Indicates a dependency between projects due to an Architecture issue. This means an architecture element must first be provided by a project before the next project can begin. A connection starts with a project and points to the project that is dependent on the source of the dependency.
- R: Indicates a dependency between projects due to a Resource issue. This means a project must first be completed so that the resource is freed up to begin the next project. A connection starts with a project and points to the project that is dependent on the source of the dependency.
- Yellow lines indicate that the project dependencies exist due to common affected architecture elements. A connection starts with a project and points to the project that shares common affected architecture. The number on the source project as well as the thickness of the line indicate how many affected architecture elements both projects have in common. Double-click the number to view a report showing the common architecture elements and the projects that share those assets.
- To focus on a specific project to focus on its dependencies, click local filter button > Focus Project. The drop-down list will show only the projects that have dependencies that match the other filter criteria such as Project Group, Status, etc.
What does the RAG status mean
The RAG status is used in project management to indicate the status of projects in order to quickly identify if management action is required for a project. The colors used to highlight the RAG Status on projects are based on the project monitoring indicators Budget, Resource, and Time.
- A red project is likely to deliver late or over budget. This project requires immediate attention.
- An orange project has missed some targets but the end date/budget is not at risk. This project should be closely monitored to ensure that it does not become at risk.
- A green project is on track.
Monitor your IT transformation and mitigate project failure. Look for all projects where the RAG status is Red to understand whether the issue is due to missed deadlines, insufficient resources, or overspending. Contact stakeholders and other responsible persons to correct the issue.
Click for more details about how the RAG status values are calculated.
How can I edit the projects and project dependencies in Where are our project dependencies?
To edit a project dependency:
- Select a project that you want to understand and click the
 edit button.
- Select Edit Project Dependencies to open the wizard.
- Project Dependency step: Click the New button to create a new dependency for the project or select a project in the dataset and click Edit to change the dependency type.
- Architecture Scope step: Click the matrix cell for the object class representing the affected architecture element you want to create and click New Add Existing Architecture Element. Select the architecture element and click OK.
To edit a project:
- Click the edit button.
- Select Edit Projects to open the Projects data workbench.
- Use the features of the data workbench to slice-and-dice your data to focus on data and do the analyses you are interested in:
- Click Structure and add or remove columns to the data table. Include relevant attributes and indicators to capture important data. A tooltip explains the purpose of each attribute, indicator, and role that you can add.
- Click Visualize to view the data in a different graphic visualization. You can save these visualizations to your content repository and used them in other content area pages.
Click here for details about how to take advantage of all functionalities of the data workbench.
What data is required for Where are our project dependencies?
Business question: Where are our project dependencies?
Purpose: Understand projects and their dependencies to other projects due to issues of time, architecture, or resources.
DATA REQUIREMENTS
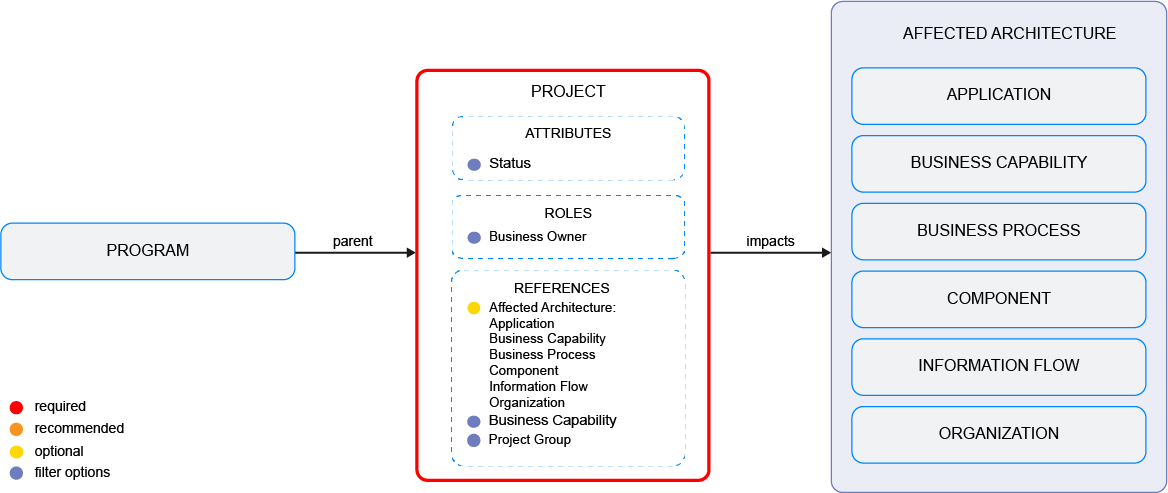
Capture the data necessary for the business question. Projects , programs , applications , business capabilities , business processes , components , information flows , and organizations must be in the repository and well documented. Try to capture as much information as possible about the projects and affected architecture classes because complete data considerably improves the results of the business question and your ability to focus on the data that is most important to you.
- Specify the architecture that is affected by the project.
- Specify the dependencies between projects.
Improve the data and correct data quality issues. Go to the business question's Data Quality > Data Completeness. This visualization helps you to assess whether sufficient data is available to produce meaningful and reliable results for the business question.
- Go to Pending Issues to resolve data quality issues and improve the data that the business question is based on. Only the first 5000 issues are displayed.
- Go to the Data Source page to understand the underlying data relevant to the business question. The data source is a list report and cannot be edited.