
The business question What are our investment and retirement candidates? looks at application scores and helps you to decide where to focus rationalization activities.
Review the business and technical scores of an application when making decisions about whether it is best to keep an application, invest in the application, consider the application as a migration candidate, or sundown the application. Compare the recommendations that were made for each application with the real-world business and technical scores and consider which applications may qualify as candidates to invest or retire in order to meet rationalization goals.
Navigate to What are our investment/retirement candidates?
Use the method that is most convenient for you:
- In the left navigation panel, enter What are our investment/retirement candidates? in the Search Navigation field.
- In the left navigation panel, click Home. In the content area, go to the Business Questions page and click the tile for What are our investment/retirement candidates?
- In the left navigation panel, expand the sections Business Questions and Rationalization and click What are our investment/retirement candidates?
What information is displayed in What are our investment/retirement candidates?

TIME Portfolio Analysis: The 2x2 matrix compares the business and technical scores of an application to the recommendation specified for the application. Applications that do not have the required business and technical scores are not evaluated. Here's how to interpret the information:
- The Y-axis represents the weighted score based on an application's Technical Score indicators.
- The X-axis represents the weighted score based on an application's Business Score indicators.
- Applications are visualized as bubbles and placed in one of four quadrants based on the computation of the business and technical scores:
- Tolerate: Keep application
- Invest: Invest in application
- Migrate: Consider application as a migration candidate
- Eliminate: Sundown application
- The bubble size indicates the application cost based on the current year operational expenditure (OpEx). The larger the bubble, the more expensive is the application.
- The bubble color indicates the correspondence of the business and technical scores with the strategic recommendation specified via the application's Recommendation attribute.
- Green bubbles indicate that the business/technical scores correspond to the strategic recommendation specified for the application.
- Red bubbles indicate that the strategic recommendation is not aligned with the business/technical scores of the application.
- Grey bubbles indicate the the Recommendation attribute is not defined for the application.
- Point to an application to show a tooltip with the following information: Application name, business score ( BS ), technical score ( TS ), Recommendation value, current year operational expenditure ( OpEx).
Application Recommendation: Shows applications based on the definition of the Recommendation attribute. Point to a doughnut slice to display a tooltip with the number of applications with that recommendation. Double-click a doughnut slice to open a data workbench showing all applications with the recommendation. You can edit an application's Recommendation attribute directly in the data workbench.
How are Business Score and Technical Score calculated in What are our investment/retirement candidates?
Applications that do not have the required Business Score and Technical Score are not evaluated and thus not included in the business question.
Here's how the indicators are weighted for Business Score:
- BS - Business Relevance: 0 = Unknown / 1 = Business Operating / 2 = Business Enabling / 3 = not applicable / 4 = Business Evolving / 5 = Mission Critical.
- BS - Numbers of Users: 0 = 0 / 1 = 1-10 / 2 = 11-100 / 3 = 101-1.000 / 4 = 1.001-10.000 / 5>10.000
- BS - Ownership: 0 = Unknown / 1 = other role / 2 = not applicable / 3 = IT Owner / 4 = Business Owner / 5 = Business Owner and IT Owner.
- BS - Provided Capabilities: (0 = 0 / 1 = 1 / 2 = 2-3 / 3 = 4-5 / 4 = 6-7 / 5>7)
- BS - Using Organizations: (0 = 0 / 1 = 1 / 2 = 2-3 / 3 = 4-5 / 4 = 6-7 / 5>7)
Here's how the indicators are weighted for Technical Score:
- TS - Application Age (months): 0 > 120 / 1 = 73-120 / 2 = 49-72 / 3 = 25-48 / 4 = 12-24 / 5 < 24
- TS - Architecture Type: 0 = unknown / 1 = Mainframe / 2 = Distributed / 3 = Client Server / 4 = Stand Alone / 5 = Cloud Based ext. Webpage.
- TS - Vendor Support Lifespan (months): 0 <= 0 / 1 = 1-3 / 2 = 4-9 / 3 = 10-18 / 4 = 19-24 / 5 > 24
- TS - Development Type: 0 = unknown / 1 = not applicable / 2 = Bespoke / 3 = COTS-Customized / 4 = not applicable / 5 = COTS-Configured
- TS - Interfaces: 0 = 0 / 1 = 1 / 2 = 2-3 / 3 = 4-6 / 4 = 7-9 / 5 > 10
How can I get even better insight to my application portfolio?
Any bubble that is grey does not have a strategic recommendation and therefore has no basis for future planning.
Go to the Application Recommendation report and click the Undefined slice to open a data workbench where you can specify the Recommendation attribute for all applications that are currently undefined.
What data is required for What are our investment/retirement candidates?
Business question: What are our investment/retirement candidates?
Purpose: Compare the recommendations that were made for each application with the real-world business and technical scores and consider which applications may qualify as candidates to invest or retire in order to meet rationalization goals.
DATA REQUIREMENTS
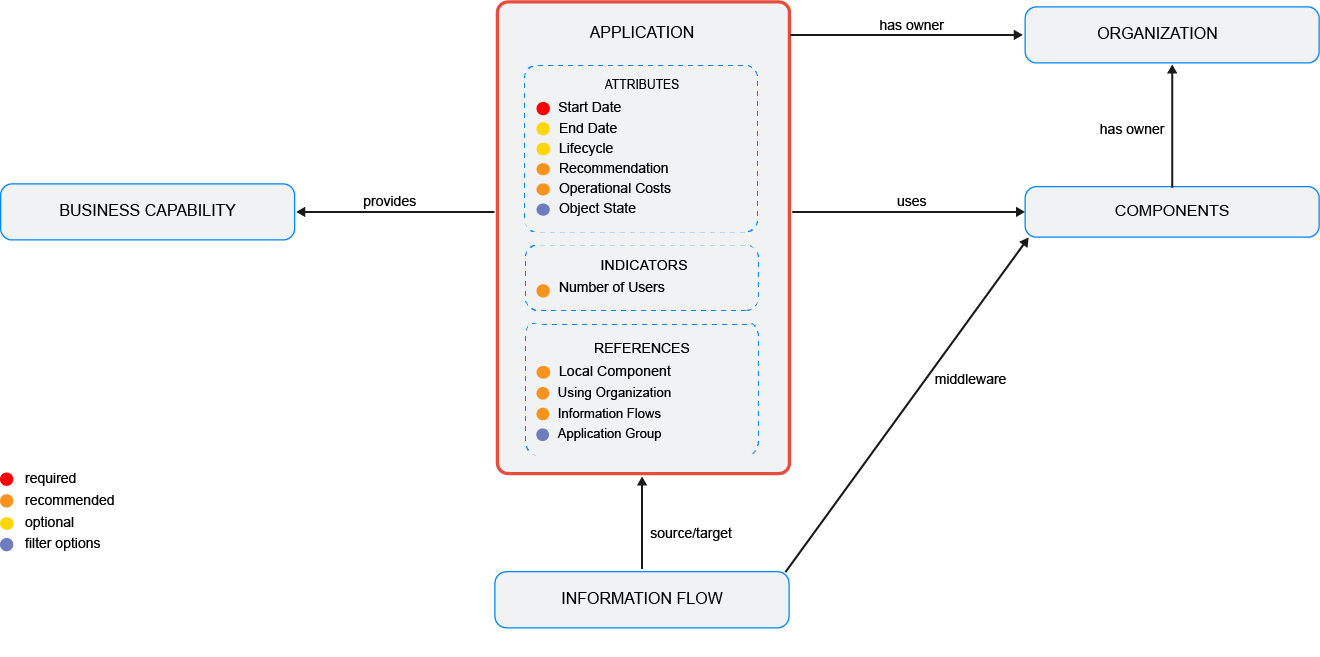
Capture the data necessary for the business question. Applications , business capabilities , information flows , components , and Capture organization data must be in the repository and well documented. Capture as much information about the applications, business capabiliteis, information flows, components, and organizations as possible because complete data considerably improves the results of the business question and your ability to focus on the data that is most important to you.
- Specify the application's attributes including Start Date, End Date, and Recommendation.
- Document the application's lifecycle.
- Capture the application's planned operational costs.
- Evaluate the application's indicators including the Number of Users indicator.
- Define responsibilities for the application includig the Business Owner role.
- Document the business capabilities that the application provides.
- Document the application's information flows.
- Document the components that the application uses.
- Start Date and End Date
- Lifecycle including lifecycle phases
- Recommendation attribute
- Architecture Type attribute
- Development Type attribute
- Number of Users indicator
- Operational costs
- Responsibilities definitions for Business Owner and IT Owner
- Business capabilities that the application provides
- Organizations using the application
Improve the data and correct data quality issues. Go to the business question's Data Quality > Data Completeness. This visualization helps you to assess whether sufficient data is available to produce meaningful and reliable results for the business question.
- Go to Pending Issues to resolve data quality issues and improve the data that the business question is based on. Only the first 5000 issues are displayed.
- Go to the Data Source page to understand the underlying data relevant to the business question. The data source is a list report and cannot be edited.