Where can we expect resource constraints?
The business question Where can we expect resource constraints? provides critical visibility into organizational resource demands over time. By highlighting when and where projects may be at risk due to potential shortfalls, it enables proactive management of resource allocation. At the core of this analysis is a pivot table that maps organizations and their subordinate units on the Y-axis against quarterly intervals on the X-axis. This view captures both the volume of resource requests and the number of projects requiring them. To ensure risks are immediately identifiable, requests exceeding 30 per organization per quarter are flagged in red. This business question serves as a strategic tool for identifying bottlenecks in resource distribution. It empowers decision-makers to reallocate requests across organizations or adjust timelines, thereby reducing delivery risks and strengthening overall project execution.
The license package Strategic Portfolio Management is required to work with this business question. The use case Resource Management must be activated.
Use the method that is most convenient for you:
- In the left navigation panel, enter Where can we expect resource constraints? in the Search Navigation field.
- In the left navigation panel, click Home. In the content area, go to the Business Questions page and click the tile for Where can we expect resource constraints?
- In the left navigation panel, expand the sections Business Questions and Transformation and click Where can we expect resource constraints?
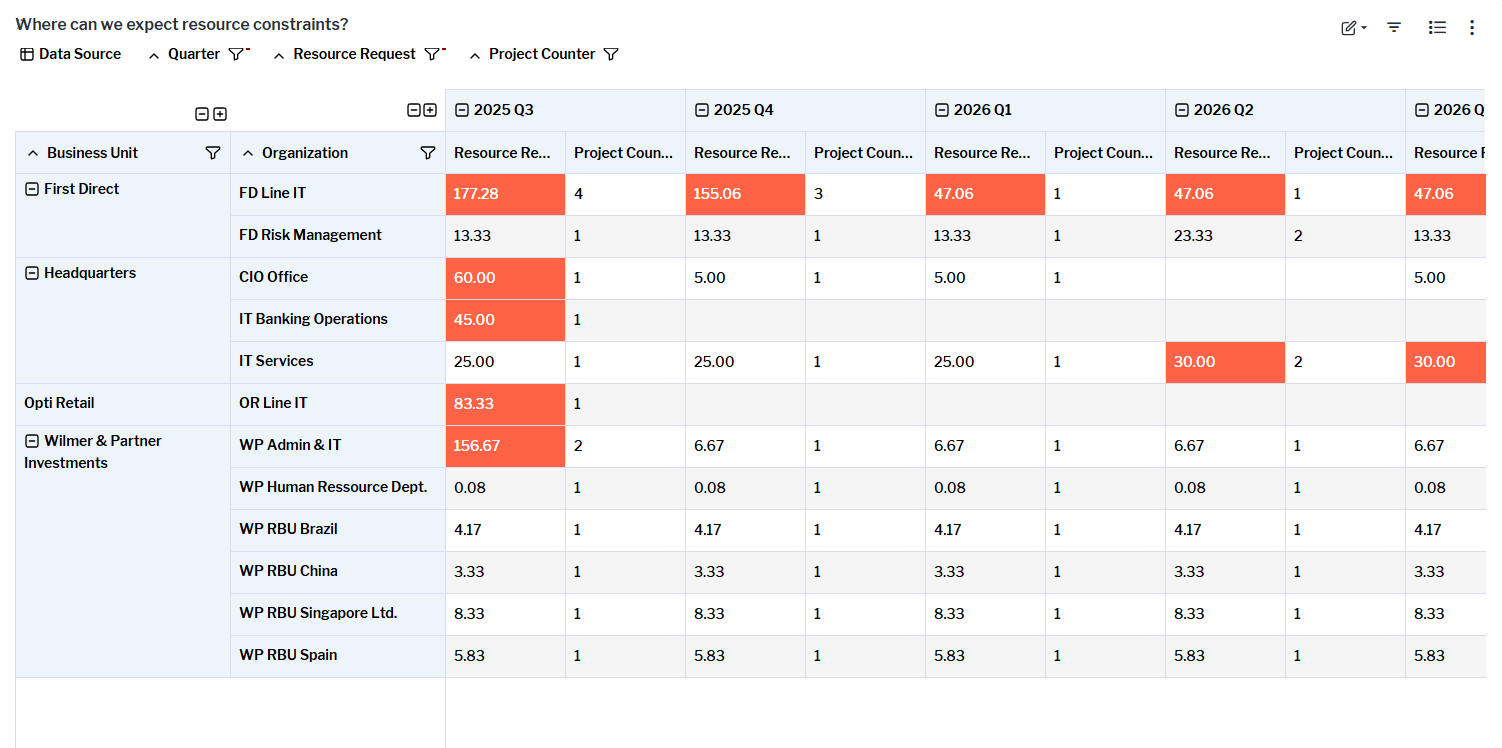
The business question shows a pivot table with organizations and subordinate organizations requested to provide resources.
- The Y-axis shows the organizations and subordinate organizations requested to provide resources for projects.
- The X-axis displays quarterly intervals, showing both resource requests and the number of projects requesting them.
- Resource requests are highlighted red if they exceed the threshold of 30 or more resource requests per organization per quarter.
If you have the relevant access permissions, you can edit the projects in this business question.
- To open a data workbench to edit projects, click the
 edit button > Edit Projects. Use the features of the data workbench to slice-and-dice your data to focus on data and do the analyses you are interested in.
Projects and organizations must be in the repository and well-documented. The following data is required in order to have meaningful results:
- Project > Resource requests
- Project > End Date
Go to the Data Quality page. The Data Completeness view indicates the data that is recommended for meaningful results to the business question. Scroll to the Pending Issues view to resolve the issues and to ensure that the data is complete. Only the first 5000 issues are displayed.
Go to the Data Source page to review the data that is used to answer the business question. The data source is a list report and cannot be edited.