
The business question Which demands should be realized? looks at demand scores and helps you to assess demands and prioritize your company's activities.
Review the business value and architectural impact scores of a demand as well as the risks to the projects associated. Adjust the weighting of business value and architectural impact indicators to understand what various demands have to offer to the business and which demands to focus on and invest in from various business perspectives.
The license package Strategic Portfolio Management is required to work with this business question. The use case Demand Management must be activated.
Navigate to Which demands should be realized?
Use the method that is most convenient for you:
- In the left navigation panel, enter Which demands should be realized? in the Search Navigation field.
- In the left navigation panel, click Home. In the content area, go to the Business Questions page and click the tile for Which demands should be realized?
- In the left navigation panel, expand the sections Business Questions and Business Relationship and click Which demands should be realized?
What information is displayed in Which demands should be realized?
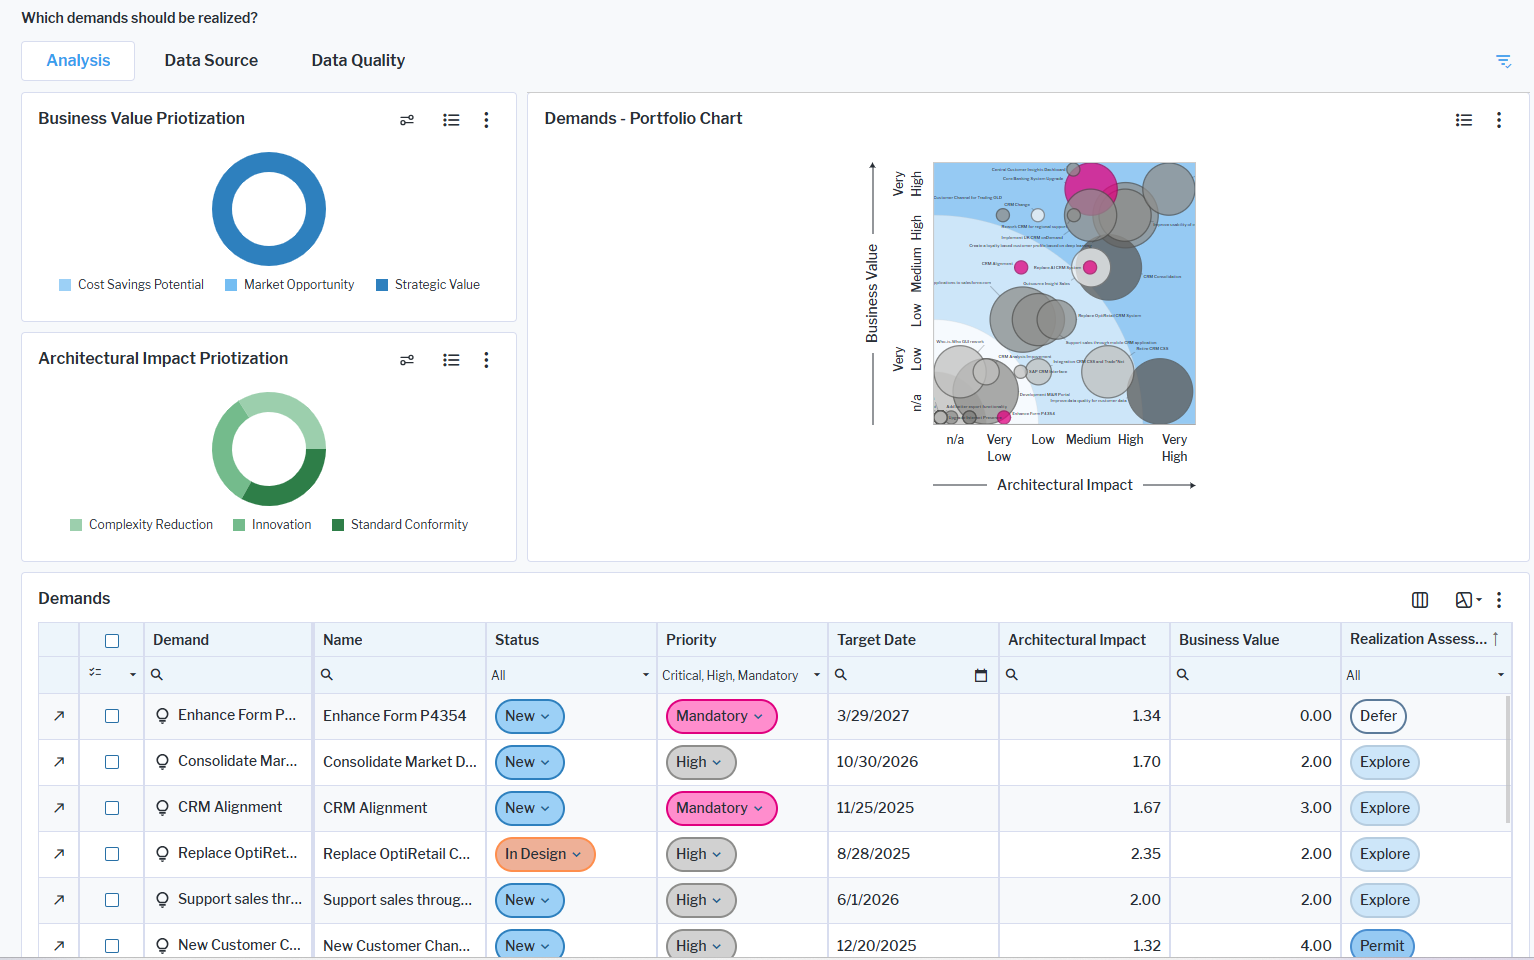
Demands - Portfolio Chart: The matrix displays demands based on the computation of the business value and architectural impact scores of each demand. Demands that do not have any business value or architectural complexity indicators defined are not evaluated. Here's how to interpret the information:
- The Y-axis represents the weighted score based on an demand's Business Value indicators.
- The X-axis represents the weighted score based on a demand's Architectural Impact indicators.
- Demands are visualized as bubbles and placed in curved segments representing the business value and architectural impact scores from very low to very high.
- The bubble size indicates the project risk indicator associated with the demand. The larger the bubble, the more risk to the projects associated with the demand.
- The bubble color indicates the importance of the demands specified via the demand's Priority attribute. Pink bubbles represent demands that are mandated and necessary to address a regulatory requirement.
- Point to a demand to show a tooltip with the following information: Demand name, business value ( BV ), architectural impact ( AI ), and Project Risk.
Business Value Prioritization: The doughnut chart shows the distribution of demands based on the indicators Cost Savings Potential, Market Opportunity, and Strategic Value. Click the Edit weightings button in the Business Value Prioritization to change the weighting of its indicators. The weighting of the indicators will automatically be updated in the Demands data workbench and reflected in the calculated property Realization Assessment.
Architectural Impact Prioritization: This doughnut chart shows the distribution of demands based on the indicators Complexity Reduction, Standardization, and Innovation. Change the weightings for the indicators as described above.
Demands: The data workbench displays all demands included in the portfolio and introduces dedicated columns for Business Value, Architectural Impact, and the calculated property Realization Assessment.
Realization Assessment dynamically evaluates each demand based on its current Business Value and Architectural Impact scores, taking the configured prioritization weightings into account. Depending on the assessment outcome, demands are categorized as Permit, Explore, Defer, or Unassessed, enabling organizations to make more informed and transparent investment and realization decisions.
How can I edit the demands in Which demands should be realized?
In the Demands - Business Value view, click a doughnut slice to open a data workbench showing all demands with the respective business value. You can edit the attributes that contribute to the business value score directly in the data workbench. Use the features of the data workbench to slice-and-dice your data to focus on data and do the analyses you are interested in:
- Click Structure and add or remove columns to the data table. Include relevant attributes and indicators to capture important data. A tooltip explains the purpose of each attribute, indicator, and role that you can add.
- Click Visualize to view the data in a different graphic visualization. You can save these visualizations to your content repository and used them in other content area pages.
Click here for details about how to take advantage of all functionalities of the data workbench.
How can I improve my data in Which demands should be realized?
Any demand that does not have the business value indicators defined is difficult to assess and prioritize.
- Go to the Demands - Business Value chart.
- Click the doughnut slice Undefined to open a data workbench showing all demands where the business value indicators are not complete.
- Specify indicators for the following columns for each demand:
- Cost Savings Potential: The estimated reduction in expenses if the demand is realized.
- Market Opportunity: The estimated amount of business opportunities if the demand is realized.
- Strategic Value: The estimated contribution to the business strategy if the demand is realized.
What data is required for Which demands should be realized?
Demands must be in the repository and well-documented. Demands that do not have the required business value, architecture impact, and project risk scores are not evaluated and thus not included in the portfolio chart. For each demand, the following should be defined:
- Priority attribute
- Cost Savings Potential indicator
- Market Opportunity indicator
- Strategic Value indicator
- Complexity Reduction indicator
- Innovation indicator
- Standard Conformity indicator
- Team Size indicator
- Duration indicator
- Technology Adoption indicator
Go to the Data Quality page and resolve the issues to ensure that the data is complete.
Go to the Data Source page to review the demands that are used to answer the business question. The data source is a list report and cannot be edited.