What is the status of our project portfolio?
The business question What is the status of our project portfolio? shows an overview of the project portfolio with a view to all projects from start to finish.
Review project monitoring indicators to indicate whether projects are within the budget and resource allotment. Understand project dependencies and keep track that project milestones are met on time. This business question helps you to understand changes as they occur and react before a project becomes unmanageable and threatens to fail.
Use the method that is most convenient for you:
- In the left navigation panel, enter What is the status of our project portfolio? in the Search Navigation field.
- In the left navigation panel, click Home. In the content area, go to the Business Questions page and click the tile for What is the status of our project portfolio?
- In the left navigation panel, expand the sections Business Questions and Transformation and click What is the status of our project portfolio?
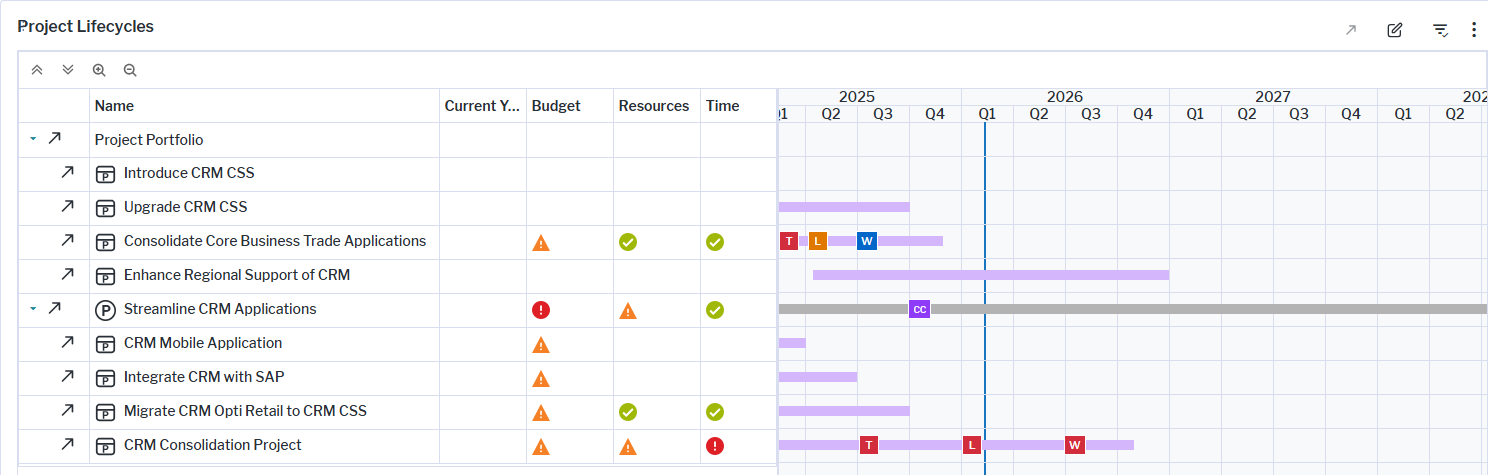
The visualization is a Gantt chart that shows the lifecycles of all projects. Here's how to interpret the information:
- The rows show
 programs and
  projects.
 - Columns show the total costs of the project's current year budget. Budget, Resources, and Time columns indicate whether projects are in good shape
 or have a warning
  or error
  .
. - Milestones are displayed on the timeline with traffic signal colors to indicate success, warning, or danger regarding their completion. Point to a milestone to display a tooltips with the milestone name and target date.
- The blue vertical line indicates the current date.
- Dependencies between projects are displayed as a black line that starts with a project's end date and points to the start of the dependent project. A dependency exists if a project must first be completed before another project can begin. Point to the black line to view a tooltip explaining the reason for the dependency and the start date of the dependent project.
If you have the relevant access permissions, you can edit the projects in this business question.
- In the Project Lifecycles view, click the
 edit button to open the Projects data workbench.
 - Edit a project directly in the data workbench or select a project and click the
 navigate button to open it's content area
Projects must be in the repository and well-documented. The following data is required in order to have meaningful results:
- Current year costs
- Start and end dates
- Project monitoring indicators Time, Resource, and Budget
- Any existing dependencies to other projects
Go to the Data Quality page. The Data Completeness view indicates the data that is recommended for meaningful results to the business question. Scroll to the Pending Issues view to resolve the issues and to ensure that the data is complete. Only the first 5000 issues are displayed.
Go to the Data Source page to review the data that is used to answer the business question. The data source is a list report and cannot be edited.