What is the status of our rationalization plan?
The business question What is the status of our rationalization plan? shows the number of new and retired applications and helps you to understand whether they are in alignment with the agreed rationalization plan.
Analyze the number of new and retired applications for different time periods and review the costs for the new and retired applications. This business question allows you to carry out a trend analysis and assess the financial impact of your rationalization activities.
Use the method that is most convenient for you:
- In the left navigation panel, enter What is the status of our rationalization plan? in the Search Navigation field.
- In the left navigation panel, click Home. In the content area, go to the Business Questions page and click the tile for What is the status of our rationalization plan?
- In the left navigation panel, expand the sections Business Questions and Rationalization and click What is the status of our rationalization plan?
The business question highlights the number of new and retired applications in the organization. The timespan of the data can be adjusted to show from 6 months - 5 years in the past as well as 6 months - 5 years in the future so that you can carry out a trend analysis and understand the impact of planned rationalization activities. The default timespan is 6 months in the past and 6 months in the future. To change the timespan of the business question, click the  local filter button and set the Timespan in Past and Timespan in Future fields.
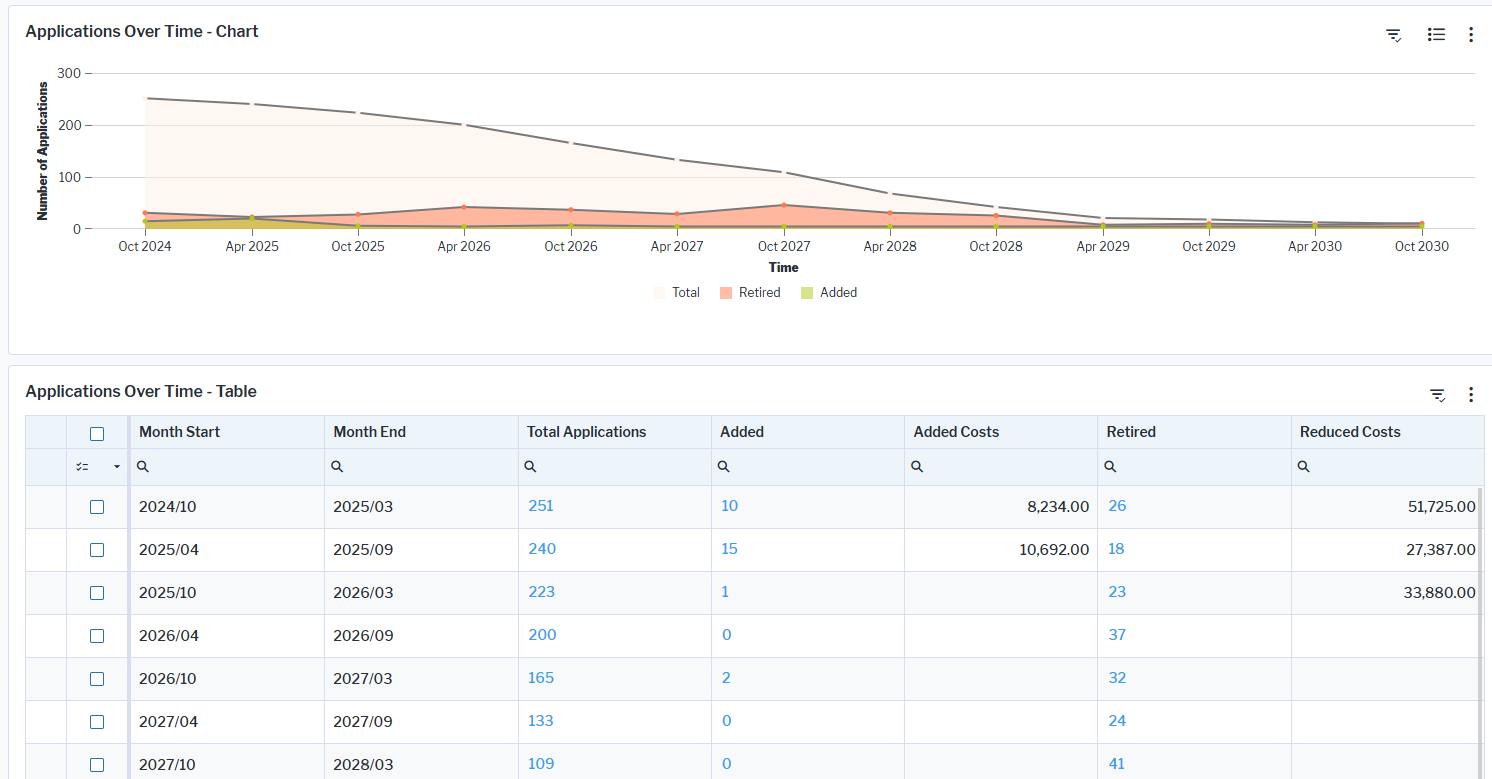
Applications Over Time - Chart: Shows a line graph showing the total number of applications in the repository over time as well as how many new applications have been added vs. retired. An added application is an application that has a start date that is before or in the current month. A retired application has an end date that is before or in the current month.
Click Total, New, or Retired in the legend below the chart to remove the corresponding data from the chart. To focus on only the new and retired applications in the chart, click the Total.
Applications Over Time - Table: Tracks the yearly numbers of total applications, new applications, and retired applications based on the timespan set in the filter. This view includes the costs of the new and retired applications so that you can assess the financial impact of your rationalization activities.
- The values in the Added Costs column is a sum of all cost types for applications that have been added in the relevant year.
- The values in the Reduced Costs column is a sum of all cost types for all applications that have been retired in the relevant year.
- Click a blue hyperlinked number to open a data workbench and review the applications that have been added/retired in the timeframe. Use the features of the data workbench to slice-and-dice your data to focus on data and do the analyses you are interested in.
Applications must be in the repository and well-documented. The following data is required for this business question:
- Start date
- End date
- Operational costs
Go to the Data Quality page and resolve the issues to ensure that the data is complete.
Go to the Data Source page to review the applications that are used to answer the business question. The data source is a list report and cannot be edited.