What is our application portfolio?
The business question What is our application portfolio? offers a comprehensive analysis of the applications in your IT and ensures a single source of truth about your application portfolio.
Get an overview of the business capabilities that are supported by the most applications, which organizations own the most applications, the object states of the applications in the application portfolio, and the numbers of applications in application groups. Review a master list of all applications including indicators and the most important information about their relationships to other assets in the IT architecture.
Use the method that is most convenient for you:
- In the left navigation panel, enter What is our application portfolio? in the Search Navigation field.
- In the left navigation panel, click Home. In the content area, go to the Business Questions page and click the tile for What is our application portfolio?
- In the left navigation panel, expand the sections Business Questions and Transparency and click What is our application portfolio?
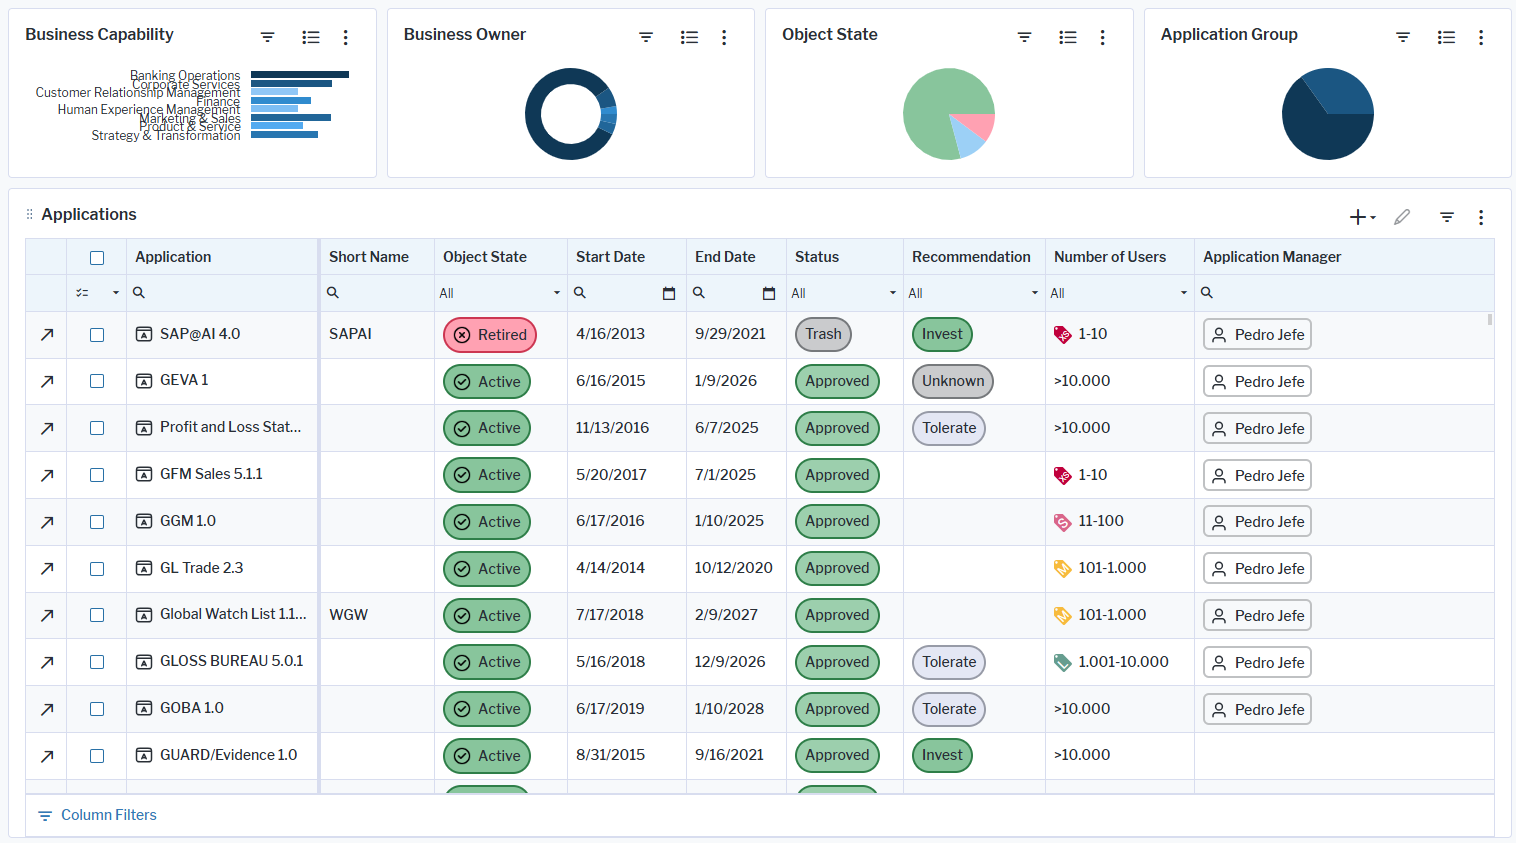
This business question shows the following information:
-
Business Capability: The bar chart displays business capabilities based on the number of supporting applications. Click the
 local filter button and select a business capability in the Business Capability field. Point to a bar to display a tooltip with the name of the business capability and the number of applications supporting it. Double click a bar to navigate to the business capability and review the applications in the Providing Applications view.
 -
Business Owner: The doughnut chart shows organizations on the second level in the organization hierarchy based on the number of applications that the organization is responsible for. This includes the applications assigned to the subordinate organizations in the hierarchy. To understand how many applications are owned by an organization on a subordinate level in the organization hierarchy, click the local filter button and specify the organization's name.
- Object State: The pie chart shows number of applications having an Active, Plan, and Retired object state.
-
Application Group: The pie chart shows the number of applications assigned to application groups on the first level of the application group. To understand how many applications are assigned to an application group on a subordinate level in the hierarchy, click the local filter button and specify the application group's name.
- The Applications data workbench shows a master list of all applications. Use the features of the data workbench to slice-and-dice your data to focus on data and do the analyses you are interested in.
If you have the relevant access permissions, you can edit the applications in this business question.
The Applications data workbench shows a master list of all applications. Use the features of the data workbench to slice-and-dice your data to focus on data and do the analyses you are interested in. For example, review how many applications will reach end-of-life soon, assess the complexity of the application landscape based on the number of information flows, and understand the costs of the application portfolio.
Here's what you can do to change the data in the view according to your needs:
- Click the
 global filter button and specify the filter fields to focus the data on a specific business capability, business owner organization, application state, and application group. The global filter will be applied to all business charts and the Applications view.
 - Click the caption Applications to drill down to have more space and to focus only on the data workbench.
- Click Structure and add or remove columns to the data table. A tooltip explains the purpose of each attribute, indicator, and role that you can add.
- Set filters for columns by entering filter criteria in the column header. Click Clear in the bottom right corner to remove the filter settings.
- Click Visualize to view the data in a different graphic visualizations. You can save these visualizations to your content repository and used them in other content area pages.
- Click the
 plus sign button to create new applications directly in the context of the business question.
 - Edit existing applications directly in the data workbench.
- Select an application and click the
 navigate button to open its content area.
Applications must be in the repository and well-documented to have meaningful results for this business question. Specify all attributes and KPIs for the applications to ensure a single source of truth for all applications in the application portfolio. The following data should be captured for each application to have meaningful results for the business question What is our application portfolio?
- Description attribute: Specify the purpose of the application.
- Development Type attribute: Specify the development context of the application.
- Recommendation attribute: Specify to help decide what to do with the application in the future.
- Architecture Type attribute: Specify the supported architecture for the application.
- Authentication attribute: Specify the application security.
- Status attribute: Specify the stage of the application in the approval process.
- Start Date attribute: Specify when the application starts actively running in the enterprise.
- End Date attribute: Specify in order to plan the application lifecycle.
- Object Stateattribute: Specify if the application is currently being used.
- Application lifecycle: Specify to understand dependencies between end-of-life technologies.
- Application Manager role: Specify who the subject matter expert is for the application.
- Business Owner role: Specify who owns the application and is responsible for managing the functional requirements.
- IT Owner role: Specify who owns the application and is responsible for technical and lifecycle decisions.
- Application costs: Specify for the budgeted years.
- Information flows: Document incoming and outgoing information flows for each application to understand the business data that is being transferred between applications.
- Used components: Specify the technological architecture of the application.
- Provided business capabilities: Specify how the application supports the business capabilities.
- Numbers of Users indicator: Specify to understand the impact and use of the application.
Go to the Data Quality page. The Data Completeness view indicates the data that is recommended for meaningful results to the business question. Scroll to the Pending Issues view to resolve the issues and to ensure that the data is complete. Only the first 5000 issues are displayed.
Go to the Data Source page to review the application data that is used to answer the business question. The data source is a list report and cannot be edited.