What are our most important projects?
The business question What are our most important projects? provides visibility about the most important projects in the project portfolio and helps you to recognize when projects are at risk.
Get an overview of the organizations that own the most projects, the project groups with the most projects, and the business capabilities impacted by the most projects. Review a master list of all projects with a special focus on the RAG (Red, Amber, Green) status value for each project to quickly identify if management action is required for a project.
Use the method that is most convenient for you:
- In the left navigation panel, enter What are our most important projects? in the Search Navigation field.
- In the left navigation panel, click Home. In the content area, go to the Business Questions page and click the tile for What are our most important projects?
- In the left navigation panel, expand the sections Business Questions and Transformation and click What are our most important projects?
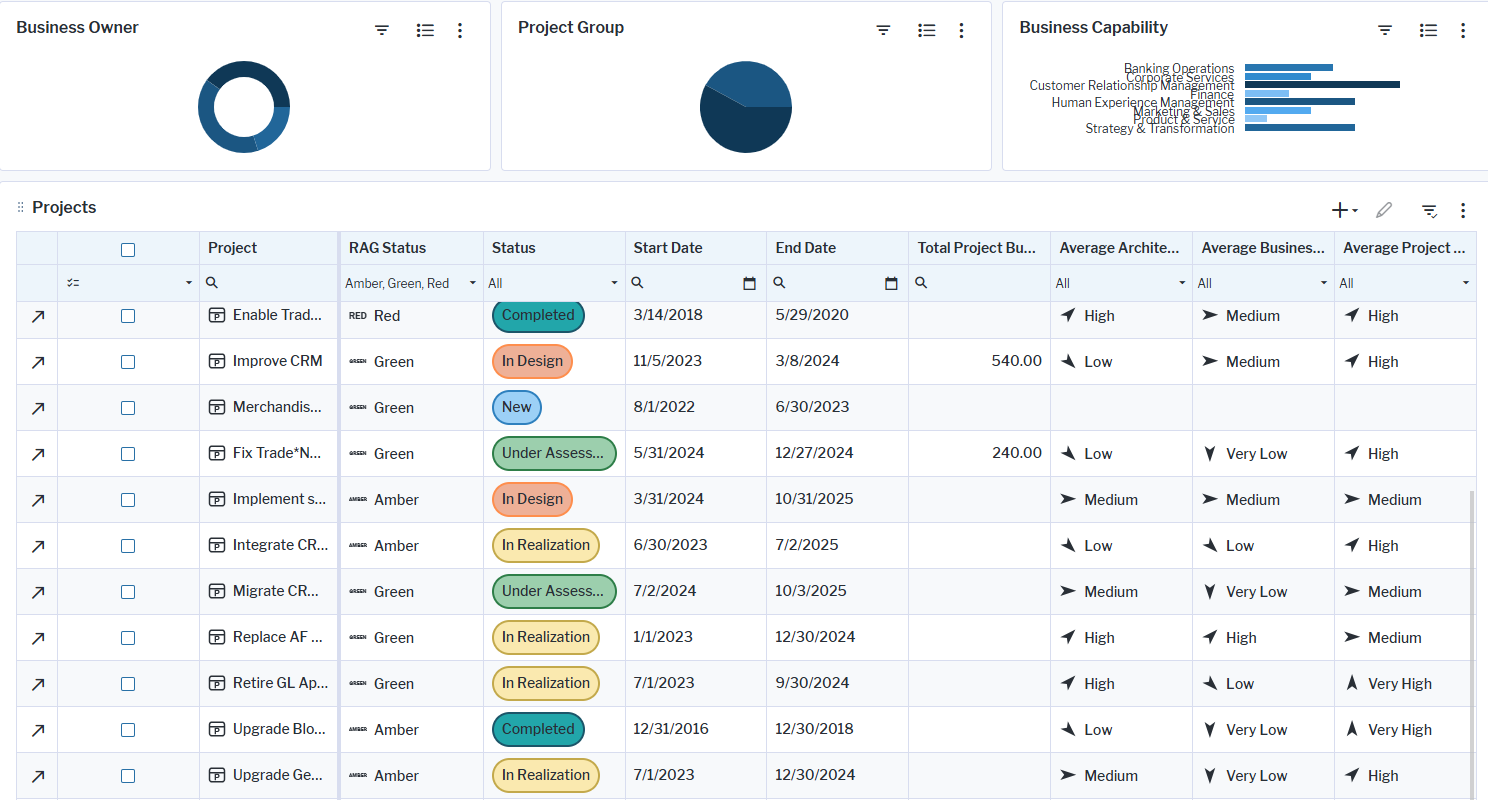
This business questions shows the following business charts:
-
Business Owner: The portfolio shows organizations on the second level in the organization hierarchy based on the number of projects that the organization is responsible for. This includes the projects assigned to the subordinate organizations in the hierarchy. To understand how many projects are owned by an organization on a subordinate level in the organization hierarchy, click the
 local filter button and specify the organization's name.
 -
Project Group: The number of projects assigned to project groups on the first level of the project group. To understand how many projects are assigned to a project group on a subordinate level in the hierarchy, click the local filter button and specify the project group's name.
- Business Capabilities: The bar chart displays business capabilities based on the number of projects that impact them directly or impact their subordinate business capabilities. Point to a bar to display a tooltip with the name of the business capability and the number of impacting projects. Click Business Capabilities to navigate to a larger view of the chart.
The Projects view is a master list showing all projects. For example, look for all projects where the RAG status is Red to understand whether the issue is due to missed deadlines, insufficient resources, or overspending. You can use all features of the data workbench to slice-and-dice your data to do the analyses you are interested in.Click here for details about how to take advantage of all functionalities of the data workbench.
The RAG status is used in project management to indicate the status of projects in order to quickly identify if management action is required for a project. The values displayed in the RAG Status column are based on the project monitoring indicators Budget, Resource, and Time.
-
 : The project is likely to deliver late or over budget. This project requires immediate attention.
 -
 : The project has missed some targets but the end date/budget is not at risk. This project should be closely monitored to ensure that it does not become at risk.
 -
 : The project is on track.
Monitor your IT transformation and mitigate project failure. Look for all projects where the RAG status is Red to understand whether the issue is due to missed deadlines, insufficient resources, or overspending. Contact stakeholders and other responsible persons to correct the issue.
-
: The RAG status is Red if any of the following indicators has one of these values:
- Budget = 3-Out of Budget
- Resource = 3-Overdrawn
- Time = 3-Out of Time
-
: The RAG status is Amber if the conditions for Red are not met and any of the following indicators has one of these values:
- Budget = 2-Almost in Budget
- Resource = 2-At Risk
- Time = 2-Almost on Time
-
: The RAG status is Green if the conditions for Red and Amber are not met and any of the following indicators has one of these values:
- Budget = 1-In Budget
- Resource = 1-In Plan
- Time = 1-On Time
A project's Average Project Risk is the average calculation the indicators specified for the evaluation type Project Risk:
-
Duration: Risk resulting from the tendency that longer projects fail more often. This might be due to staff turnover or the complexity of work typical for longer projects.
- 1- Very High (> 18 months)
- 2- High (12 - 18 months)
- 3- Medium (7 - 11 months)
- 4- Low (3 - 6 months)
- 5- Very Low (<2 months)
-
Team Size: Risk resulting from the team size of the project team. The larger the team, the more considerable are coordination and communication efforts.
- 1- Very High (> 50)
- 2- High (20 - 50)
- 3- Medium (10 - 19)
- 4- Low (5 - 9)
- 5- Very Low (<5)
-
Technology Adoption: Technology adoption risks are measured by the availability of in-house competence for the technologies dominant in the project. The more new technologies that are used, the higher the risk.
- 1- Very High (new technology in prototyping)
- 2- High (new technology with experienced partner)
- 3- Medium (new version of familiar technology)
- 4- Low (in-house familiarity)
- 5- Very Low (in-house expertise)
A project's Average Business Value is the average calculation the indicators specified for the evaluation type Business Value:
- Cost Savings Potential:
- Market Opportunity
- Strategic Value
The indicators may have the following values: 1- Very High, 2- High , 3- Medium, 4- Low, 5- Very Low
A project's Average Architectural Impact is the average calculation the indicators specified for the evaluation type Architecture Impact:
- Complexity Reduction
- Standard Conformity
- Innovation
The indicators may have the following values: 1- Very High, 2- High , 3- Medium, 4- Low, 5- Very Low
The current year budget is based on the operational expenses of the project for the current year. The total year budget is based on the operational expenses of the project for all years. The calculation is based on the sum of the budget values for the following cost types:
- Software License Cost
- Software Maintenance Cost
- Infrastructure Cost
- Service Cost
- OpEx Other
- In the Projects view, click the
 plus sign button to create new projects
 - To edit a project's basic data, select the project and click the
 button
 - Edit a project directly in the data workbench. Note that many of the columns in the Projects view are calculated values and can't be edited.
- To edit a project's indicators, select a project in the the Projects view and click the
 navigate button to open it's content area > Overview > Evaluation.
Use the features of the data workbench to slice-and-dice your data to focus on data and do the analyses you are interested in:
- Click Structure and add or remove columns to the data table. Include relevant attributes and indicators to capture important data. A tooltip explains the purpose of each attribute, indicator, and role that you can add.
- Click Visualize to view the data in a different graphic visualization. You can save these visualizations to your content repository and used them in other content area pages.
Click here for details about how to take advantage of all functionalities of the data workbench.
Projects must be in the repository and well documented. For each project, the architecture scope and the current year costs should be documented.
For every project, the following should be defined:
- The architecture affected by the project
- The current year costs
- The indicators for the evaluation types Architecture Impact, Business Value, Project Risk and Project Monitoring.
Go to the Data Quality page and resolve the issues to ensure that the data is complete.
Go to the Data Source page to review the projects that are used to answer the business question. The data source is a list report and cannot be edited.