Design data sources for analytic dashboards
Alfabet provides analytics dashboards that are based on the embedded third-party tool DevExpress® Dashboard. Analytics dashboards support end users to create ad-hoc information-rich data visualizations. Users can use the full range of visualization possibilities available in the DevExpress Dashboard Designer. One or more dashboard items such as charts, scatter charts, grids, cards, gauges, pivots, range maps, tree-maps can be added to the analytics dashboard and filtering options such as combo-boxes, list boxes, and tree views can be leveraged.

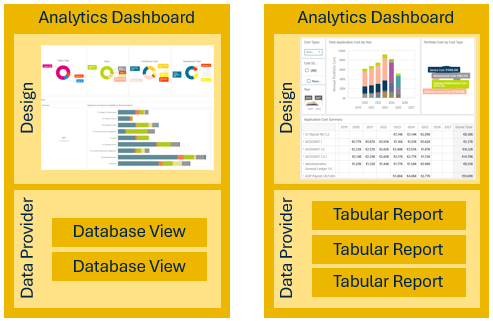
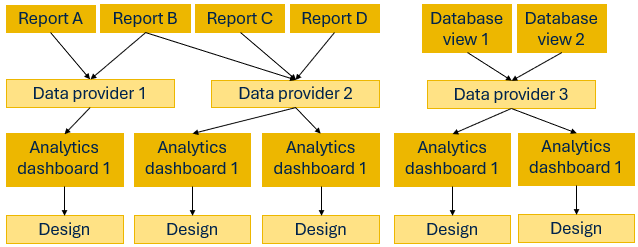
An analytic dashboard is based on a data provider which consists of one or many pre-configured reports or database views providing data from the Alfabet database in a table structure. The data from the reports or database views can then be used to design the analytic dashboard. Design includes selection of the visualization type, the data from the data provider that shall be visualized, and the overall design of the board.
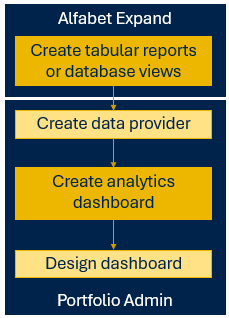
You must define the analytics dashboard stepwise:
- Define configured reports or database views as data source for the analytics dashboard.
- Define the data provider. A data provider can consist of one or multiple configured reports or one or multiple database views.
- Define the analytics dashboard, selecting a single data provider and deciding about the visibility of the view to end users.
- Define the analytics dashboard design.
The way analytics dashboards are defined provides a lot of flexibility for design. A tabular report can be used in multiple data sources, and the same data source can be used to create multiple analytics dashboards, each analyzing another aspect of the data source.
Once you have designed the analytics dashboard, it will be available to users as dashboard page in the content repository of class-independent content areas. When the user adds a dashboard page to a content area, the dashboard is visible, but not editable. The user defines the caption of the tab opening the dashboard page. Dashboard pages show a predefined content. Users cannot share the tab they added as dashboard page with other users. The content of that page is available anyway to other users via the Manage content on page > Add dashboard page.
In class-independent content areas, dashboard pages show a  icon to destinguish them from content pages.
You can also add dashboard content as default content to content areas.
Most of the steps to define an analytics dashboard are done in the user interface by an administrative user. Only the first step is done in Alfabet Expand.
If your company uses a predefined Alfabet IT Transformation Server solution, you will find the functionality to define an analytics dashboard in the Portfolio Admin user profile under Configuration > Analytics Dashboard. In addition, preconfigured reports will be available as data source.
If your company does not use the preconfigured solution, you need to add the functionalities for creating the analytics dashboard to an administrative user profile.