
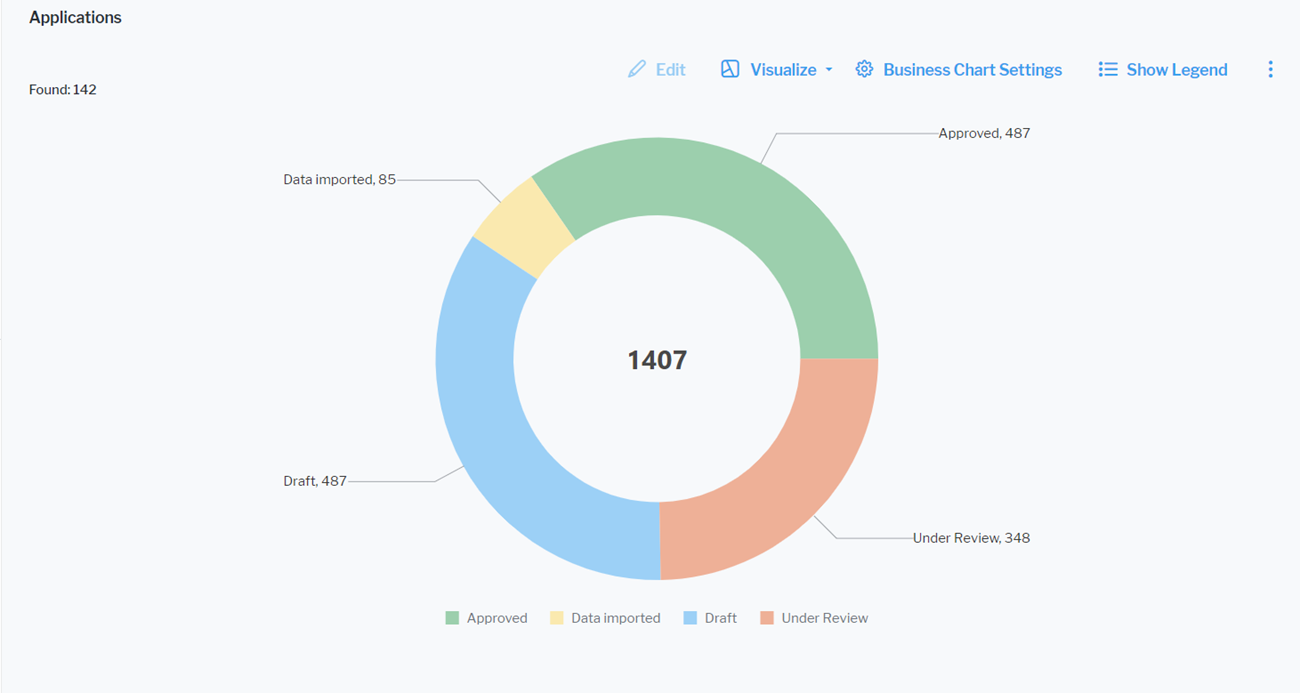
Click Visualize Data > Business Charts > Doughnut Chart. Click Business Chart Settings to set up the doughnut chart.
The assets visible in the visualization are based on the definition made in the data table. To add or remove assets, click Visualize > Data Table. Click the Structure button to change the content. Click to learn more about how to specify the data you want to see.
Define the data to display in the Data Visualization tab.
- X-Value: Select one or more attributes to show as sections in the doughnut chart.
- Y-Value: Select a numeric value that determines the size of each section in the doughnut chart. Select either <RecordCount> to show the total number of records or a numeric attribute of the asset type.
You can optionally change the layout in the Layout tab.
- Chart Title: Define a title for display on top of the chart.
- Show Sum of Values: Select the checkbox if you want the sum of all Y-values to be displayed in the center of the doughnut.
- Hide Value Labels: Set a checkmark to hide value labels on segments of the doughnut providing information about the number the segment represents.
- Number Prefix: Enter a prefix to display before the numerical value. For example, enter a currency symbol to add it in front of a monetary value in the value labels. There will be no white space between the prefix and the number.