
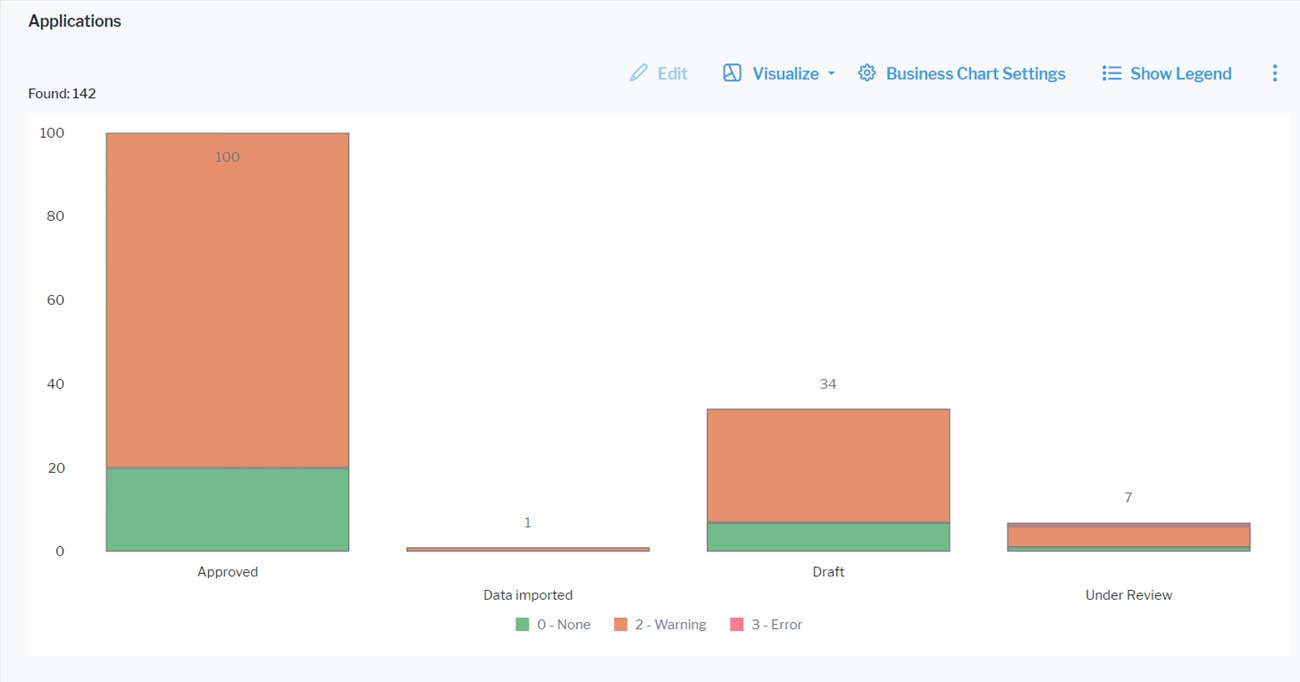
Click Visualize > Business Charts > Bar Chart. Click Business Chart Settings to set up the bar chart.
The assets visible in the visualization are based on the definition made in the data table. To add or remove assets, click Visualize > Data Table. Click the Structure button to change the content. Click to learn more about how to specify the data you want to see.
Define the data to display in the Data Visualization tab.
- X-Value: Select one or more attributes to show as the value on the X-axis.
- Y-Value: Select either <Record Count> to show the total number of records or a different number value to display on the Y-axis.
- Series: Select one or more attributes to specify a data series to further distinguish the results based on a selected attribute. The series is represented by bars of the same color in a bar chart. In a stacked layout, bars of different series are displayed on top of each other.
You can optionally change the layout in the Layout tab.
- Chart Title: Define a title for display on top of the chart.
- X-Axis Title: Define a title for display beneath the X-axis.
- Y-Axis Title: Define a title to display along the Y-axis.
- Bar Layout: Select Normal to display bars next to each other, Stacked to display bars on top of each other and Overlapped to display one bar behind the other.
- Bar Orientation: Select Horizontal to show bars stretching from left to right or Vertical to show bars stretching from top to bottom.
- Hide Value Labels: Set a checkmark to hide value labels on bars. Value labels provide information about the number the bar represents.
- Background Color: Select a color to change the color of the chart background.
- Number Prefix: Enter a prefix to display before the numerical value. For example, enter a currency symbol to add it in front of a monetary value in the value labels. There will be no white space between the prefix and the number.
- Y-Minimum Value: By default, the range of the Y-axis is adjusted to the maximum and minimum Y-values in the chart. Set this attribute to enforce a start point for the Y-axis. For example, define the same Y-axis range for multiple charts to make it easier to compare the values in the charts. If an Y-value in the chart is smaller than the selected minimum value, the minimum value setting will be ignored to ensure that all data is displayed.
- Y-Maximum Value: By default, the range of the Y-axis is adjusted to the maximum and minimum Y-values in the chart. Set this attribute to enforce an end point for the Y-axis. For example, define the same Y-axis range for multiple charts to make it easier to compare the values in the charts. If an Y-value in the chart is higher than the selected maximum value, the maximum value setting will be ignored to ensure that all data is displayed.