
- Add existing assets to the diagram
- Change the size or placement of a diagram item
- Add connections between diagram items
- Tips to improve the layout of connection items
- Use placeholders for assets in the diagram
- Add referenced assets to the diagram
- Edit data about an asset in the diagram
- Hide classes or assets in the diagram
- Remove assets from the diagram
- Add shapes to the diagram
- Change the look of diagram items and shapes
- Add text to the diagram
- Add an image to the diagram
- Adding a link to another diagram
- Adding a legend of the diagram’s change history to the diagram
- Undo your changes
The Diagram Designer is a diagramming tool that enables you to create architecture views for the assets and relationships managed in the Alfabet repository. Diagrams can be used to depict specific segments of your enterprise architecture, such as an application group and its applications, information flows and supporting components, the application landscape that enables a particular business process, or the applications and technologies affected by a transformation initiative or project.
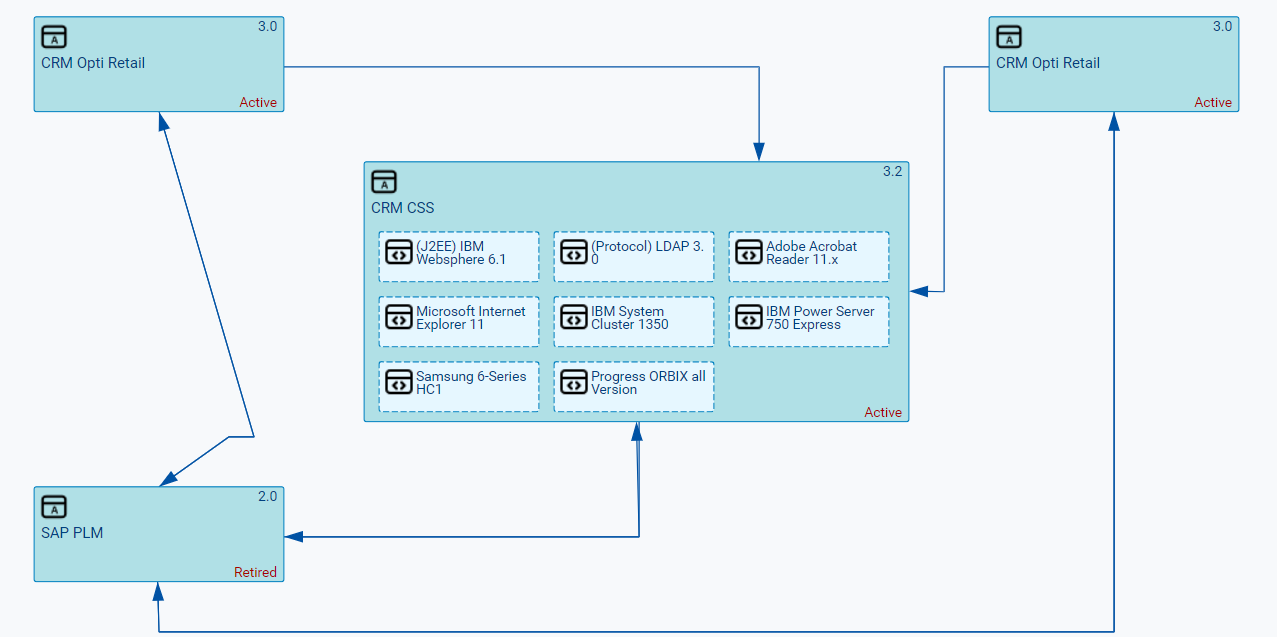
Because creating effective architecture diagrams involves both modeling and visual design, it is important to become familiar with the core capabilities of the Diagram Designer. The tool provides numerous options for adding repository objects to a diagram, simplifying complex networks of relationships, and enhancing visualizations through legends, colors, shapes, images, annotations, and other formatting elements. While these capabilities make it possible to represent sophisticated architecture landscapes, clear communication should remain the primary objective. As the number of displayed objects and relationships increases, diagrams can become more difficult to design and interpret. For this reason, it is recommended to limit diagrams to a manageable scope and include only the objects and connections necessary to communicate the intended message effectively.
When designing a diagram, you can:
- Add assets that exist in the repository to the diagram. For example, you can add applications and application groups that exist in the repository to the diagram. Any existing information flows between applications will be automatically added to the diagram.
- Create placeholder objects that you can then later replace with an asset in the repository. For example, if you don't yet know which application, application group, or information flow you want to have in your application landscape, you can add a placeholder with simple text. Later you can replace the placeholder with a relevant application, etc. that is in the repository.
- Easily add assets to the diagram that are referenced by objects in the diagram. For example, you could automatically add the local components to the diagram that a specific application references, or you could automatically add all applications assigned to a specific application group. Assets that are automatically added to a diagram can also be removed from the diagram. This allows you to understand the references that exist for an asset, and then decide on the ones to display in the diagram.
- Edit the basic attributes for a selected asset in the diagram. If you have edit permissions to an asset displayed in the diagram, then you can open its editor or navigate to its content area to modify the data. For example, with access permissions to an application, you could change its start/end dates or create a new local component for the application.
- Remove a diagram item from the diagram. You can hide any asset displayed in the diagram by removing it from the diagram. For example, you can hide an information flow so that it is not visualized. This lets you create a diagram with only the relevant information you wish to convey.
- Delete an asset that from the repository if it created in the current session of the Diagram Designer. For example, you can delete any information flow or application from the repository that was created in the context of the diagram.
- Add shapes and other design elements. You can add a legend, text, arrows, color, etc. in order to provide additional information in the diagram. you can also change the color of a diagram item. This allows you, for example, to highlight a specific diagram in the visualization of an application landscape.
Add existing assets to the diagram
When you design a diagram, you will typically add diagram items such as applications and components that exist in the repository. The diagram items that can be added to the diagram are displayed in the left sidebar in the diagramming tool. If you are adding applications to a diagram, all information flows that already exist between applications will be automatically added and displayed as connections between the applications. The arrow will start with the application that is the source of the information flow and point to the target of the information flow.
- Click the class symbol in the toolbox so that a vertical bar is displayed next it and drag the class symbol to the diagram canvas. The mouse pointer displays a large plus symbol while you drag it to the desired position.
- The relevant selector will open. Select one or multiple objects to add to the diagram and click OK to close the selector.
- The focus will be on the object you added and it will be selected. If you add multiple assets at once, they will all be selected. Click anywhere in the canvas area to clear the selection.
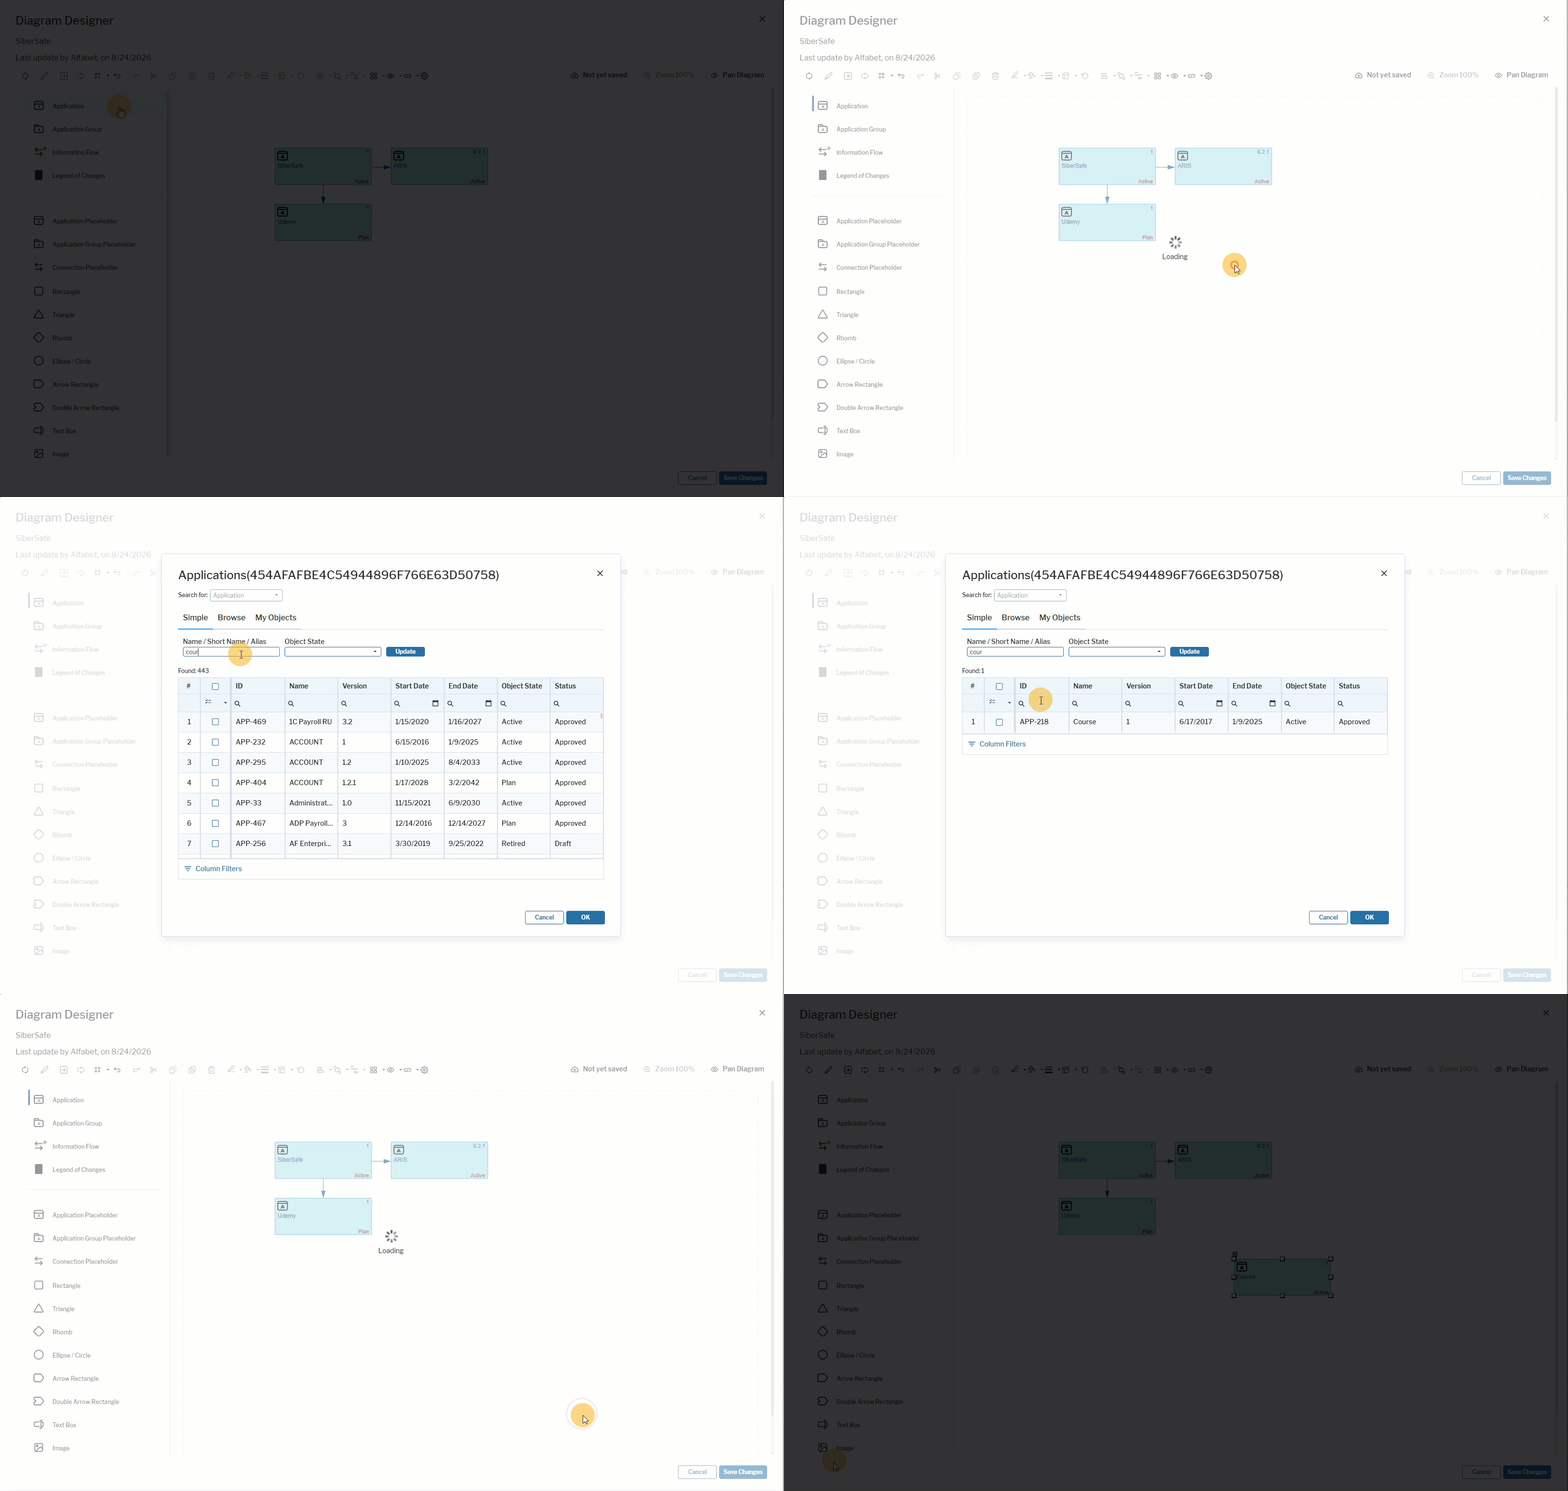 Click here to see how.
Change the size or placement of a diagram item
You can move or resize any individual diagram item or multiple diagram items. by
- To change the size of a diagram item, click it to display its handles. Drag any handle to the appropriate size.
- To move a diagram item, click to select it and then drag it to another location on the canvas.
- To select multiple diagram items, click and drag the mouse to create a selection area. All diagram items in the selection area are in the selection. Individual diagram items can be added by holding the CTRL key and selecting another diagram item. Click the selection area to move the diagram items. Drag the handle of the selection area to change the size of all of the diagram items.
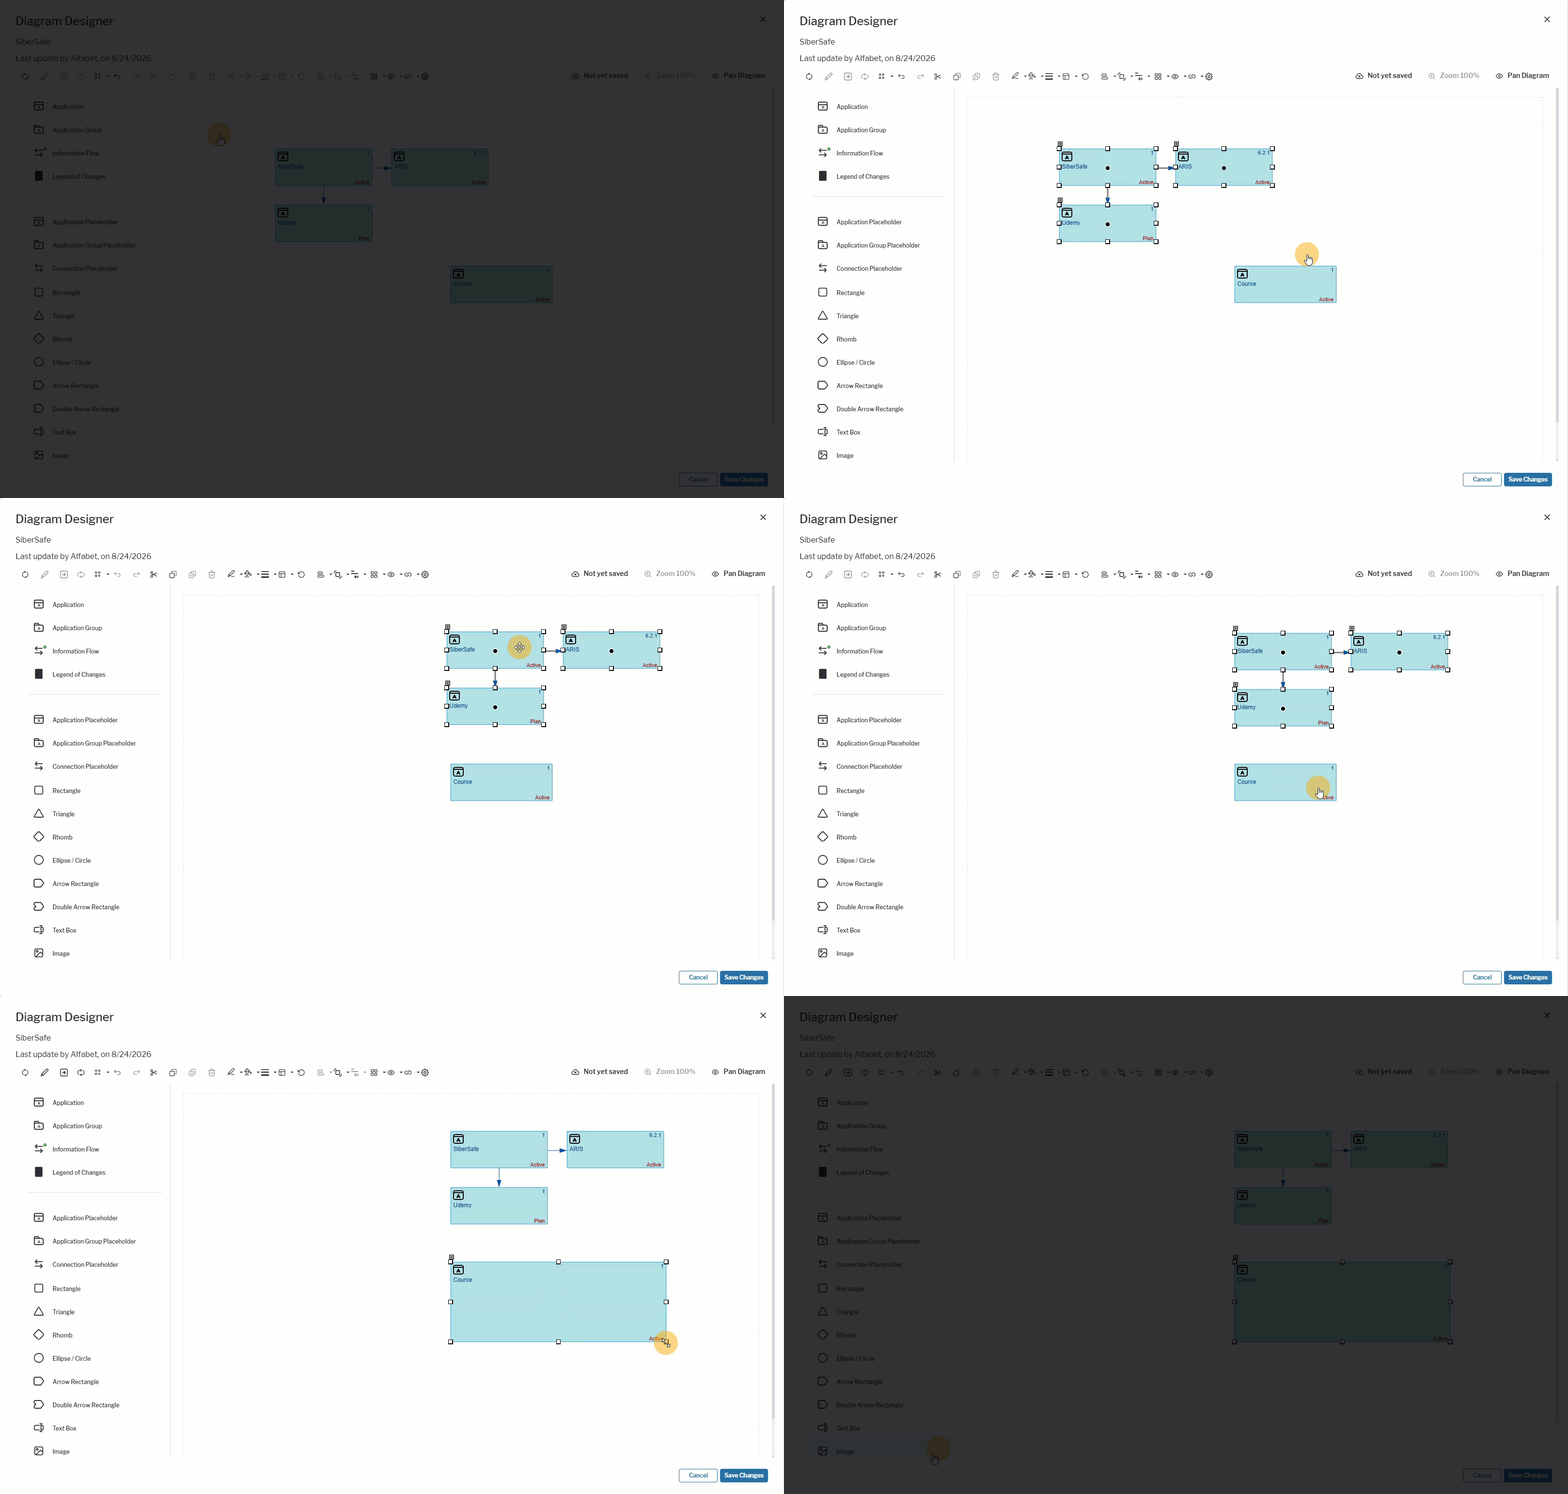 Click here to see how.
Add connections between diagram items
A connection is typically an information flow between applications although there may be other semantic connections available for other combinations of objects. Connections may be straight lines or angles depending on how the connections are specified in the diagram settings.
If information flows already exist between applications or application groups that have been added to the diagram, the information flows will be automatically displayed as arrows. The arrow will start with the diagram item that is the source of the information flow and point to the target of the information flow. Whereas new assets like applications cannot be created in the context of the diagramming tool, connection items such as information flows are an exception. If you add an information flow and connect a target and source application in the diagram, a new information flow will be created and added to the repository.
Connection items like information flows might not be displayed correctly for diagram items placed in a shape. Solutions to this issue are being investigated.
- Click the Information Flow diagram item in the toolbox.
- Hover over the application that is the source of information flow. You will see green dots on the edges as well as the center of the application. Decide which of the green points shall be where the information flow starts.
- Click the green point and drag the information flow to a green point on the target application.
- In the editor that opens, specify the mandatory attributes as well as any other optional attributes. Click OK to close the editor.
- Click the Save Changes button to save your changes.
- You can move the connection by grabbing its handle and dragging it. If the connection is elbowed and has angles, you can grab a handle on a connection to drag it to change the angle degree as well as add more angles.
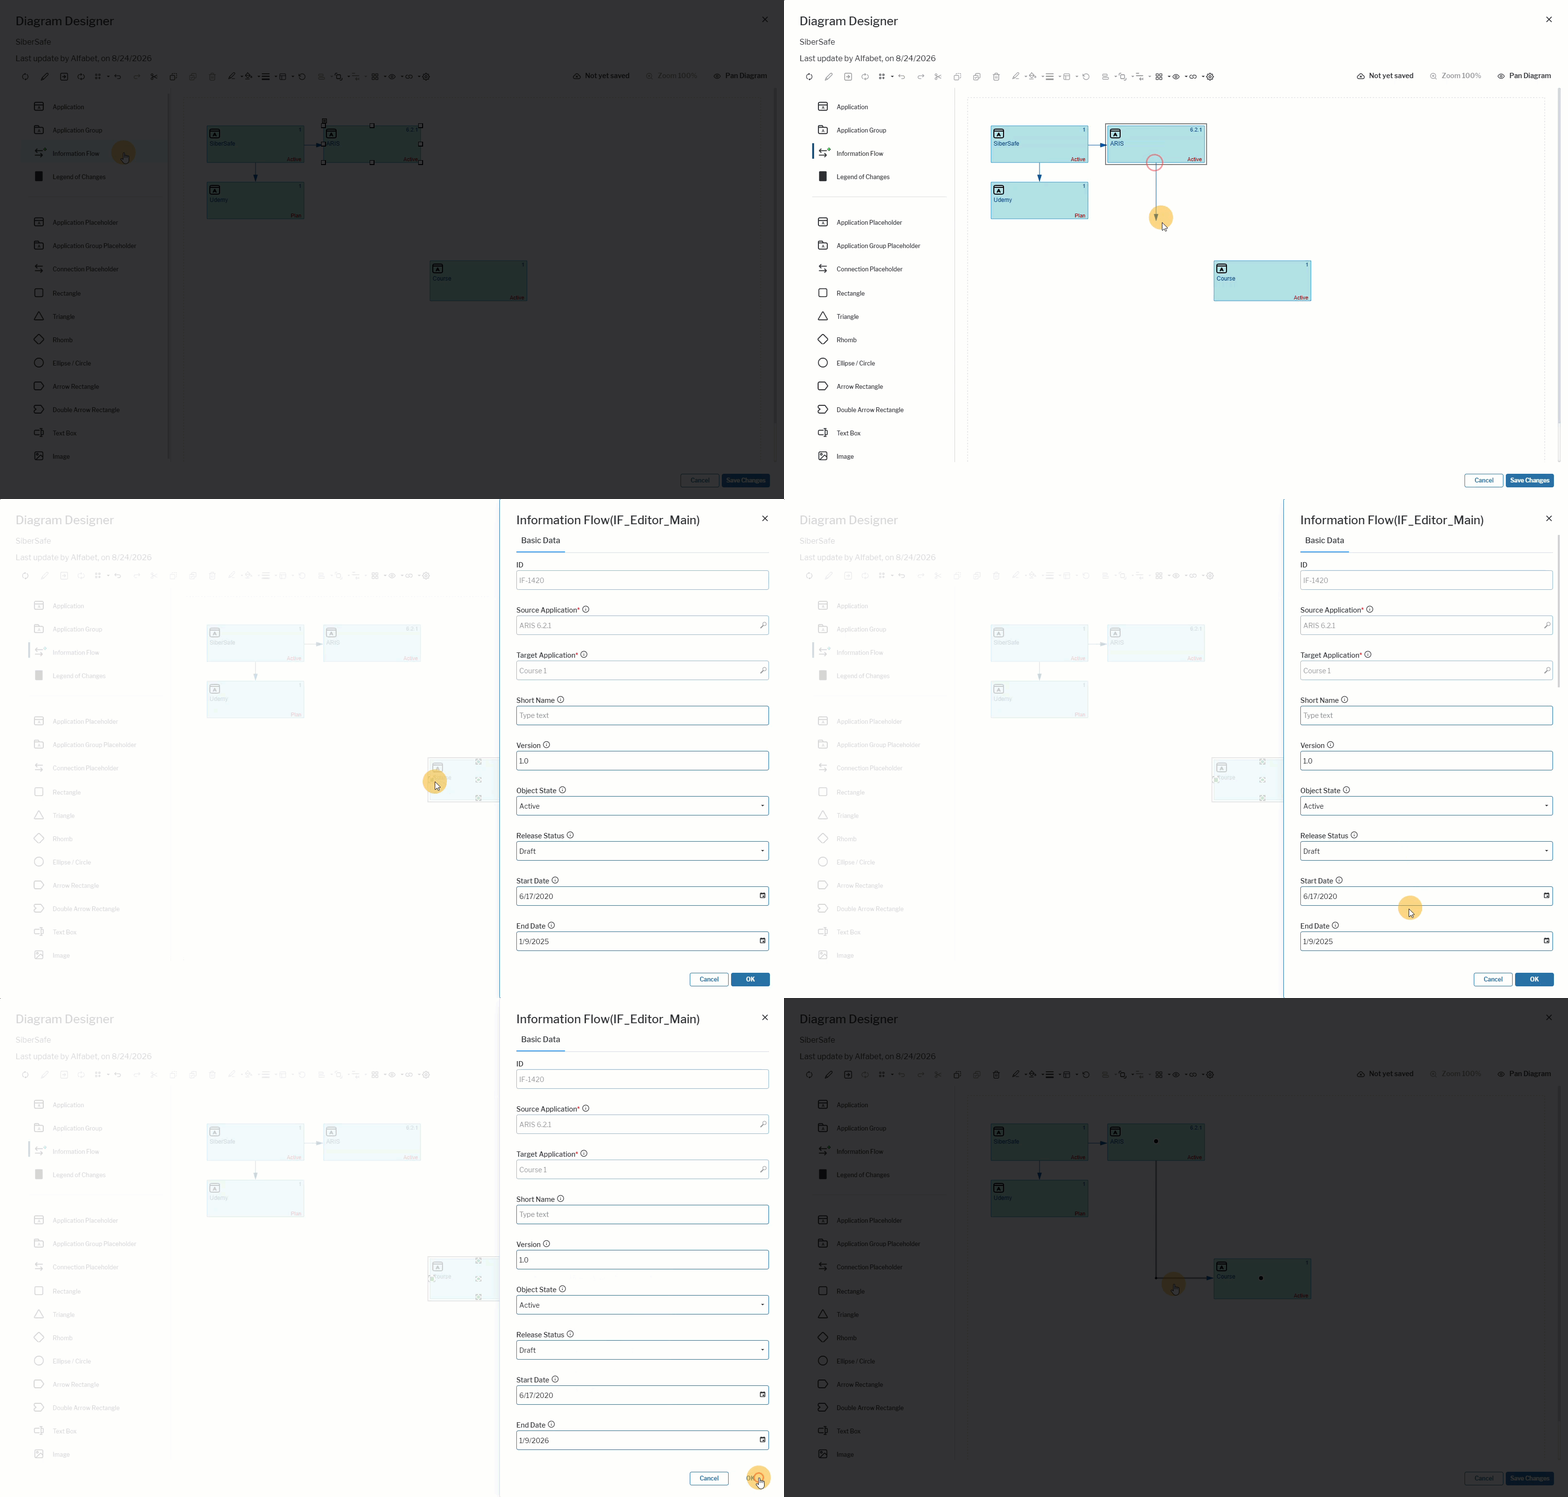 Click here to see how.
Tips to improve the layout of connection items
When a diagram contains many connection items, such as information flows, it can become difficult to follow the relationships between objects. The following techniques can help improve the layout and readability of connection items:
- Click a connection item to highlight its source and target objects. The handles at each end of the connection help identify the direction of the relationship.
- Move the source or target diagram item to create a clearer layout and reduce visual clutter.
- Drag an end handle to another side of the source or target object to adjust where the connection attaches.
- Drag a corner handle on an elbowed connection to reposition adjacent segments and improve the routing of the connection.
- Move the source or target position of a connection item. Grab a handle at the end of the connection item and drag the end handle to a different side of the object to move the end of the connection item.
- Grab a handle at a bend in the connection item to move the bend and reposition the connected sections of the connection.
- If multiple connection items share the same source or target object, you can combine them into a single connection to reduce visual clutter. To collapse similar connections, drag one connection item onto another. The connections are displayed as a single line with arrows at both ends.
Use placeholders for assets in the diagram
You can create placeholder objects for applications, application groups, and information flows, and replace them with repository assets later. This allows you to design and plan your architecture before specific applications, application groups, or information flows have been selected. Placeholder objects are visible to all users who view the diagram in the content area.
- Click the placeholder symbol in the toolbox (for example, Application Placeholder so that a vertical bar is displayed next it and drag the symbol to the diagram canvas. The mouse pointer displays a large plus symbol while you drag it to the desired position.
- Click in the placeholder item and enter a short text to indicate the purpose of the placeholder.
- Click Save Changes.
You can replace a placeholder object with an asset from the repository at any time. A placeholder can only be replaced with an asset of the same type. For example, a placeholder application can only be replaced with an existing application, and a placeholder information flow can only be replaced with an existing information flow.
- Right-click the placeholder diagram item and select Replace Object. In the selector that opens, select the asset you want to replace the placeholder with and click OK.
- Click Save Changes. The placeholder item is replaced with the asset.
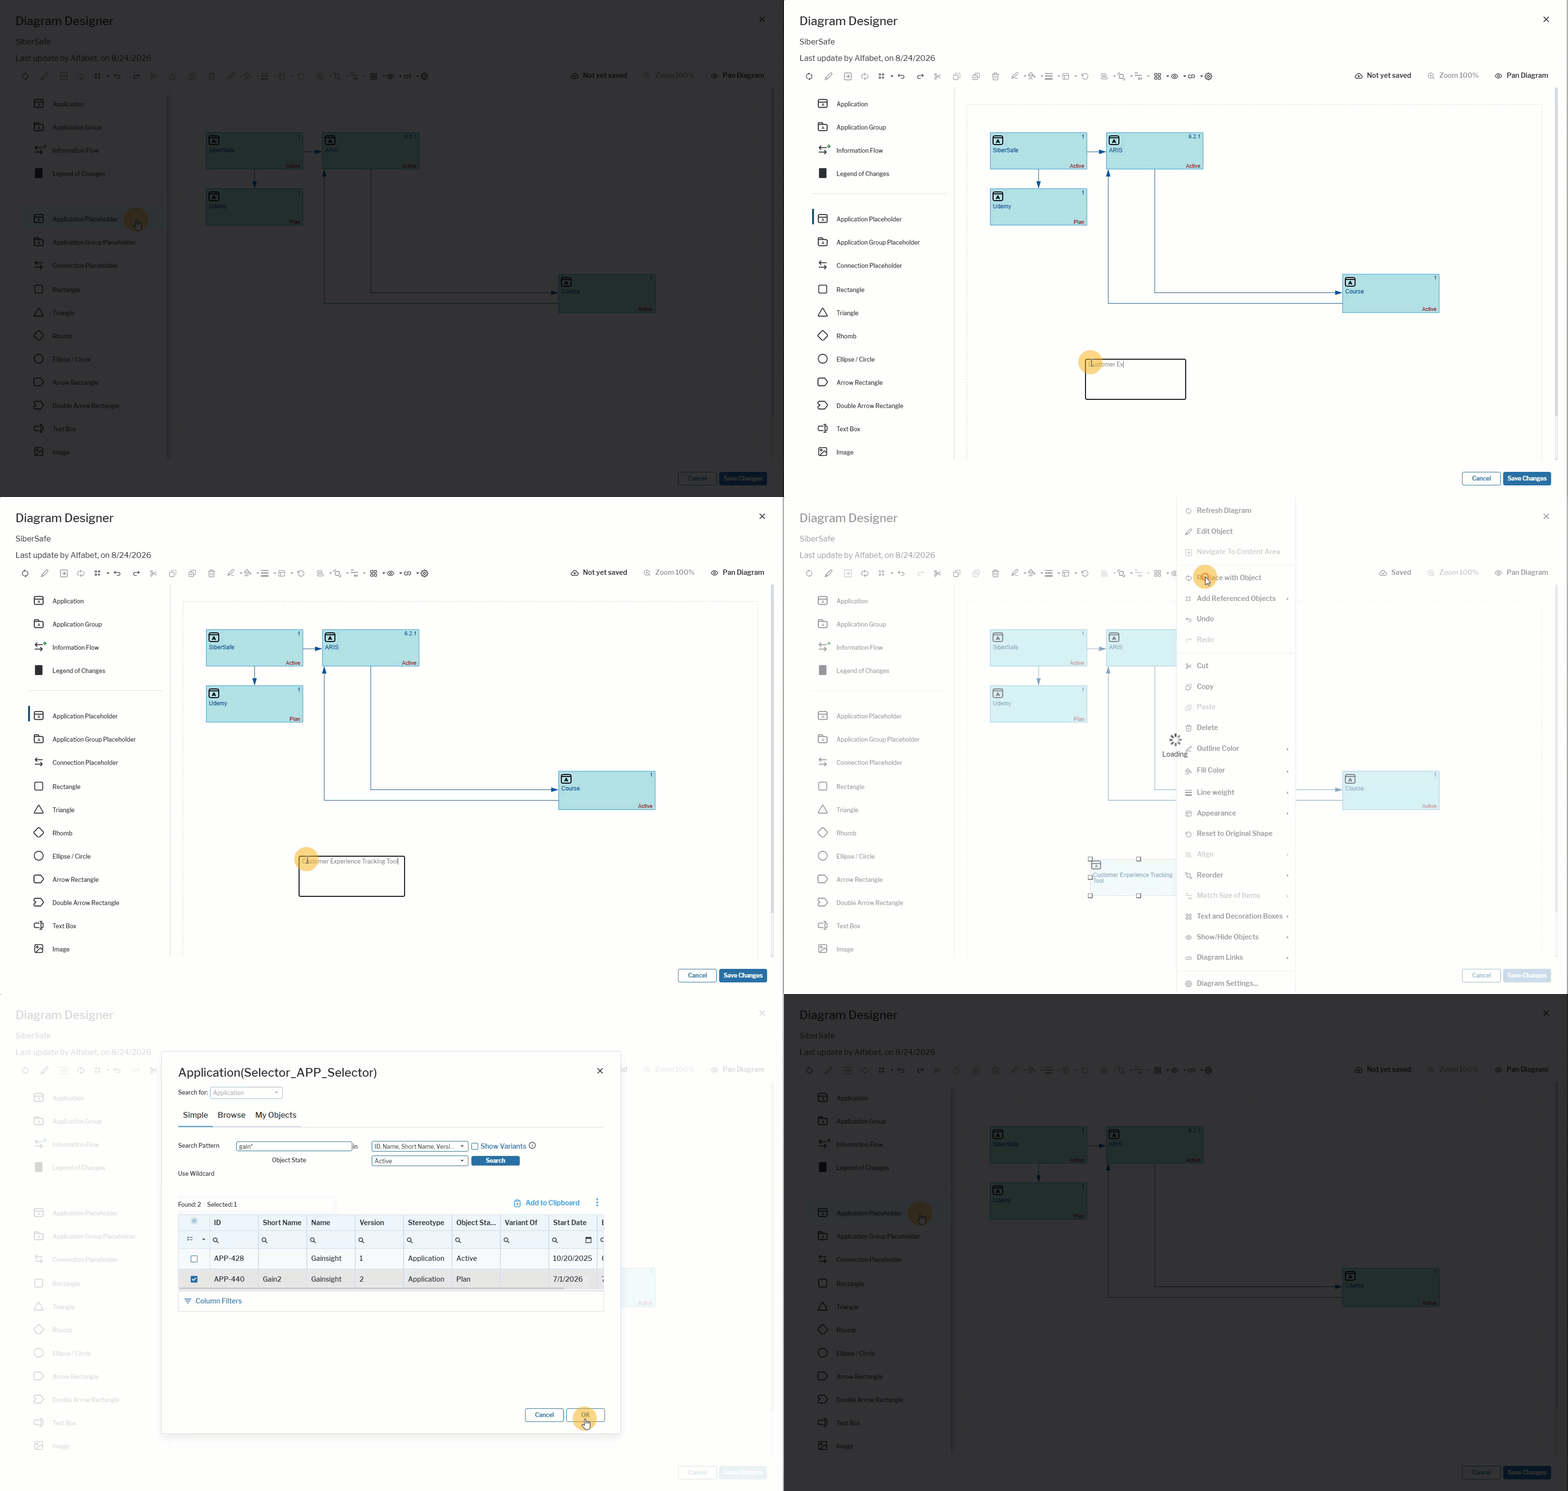 Click here to see how.
Add referenced assets to the diagram
Some assets shown in the diagram have relationships to other assets that can also be added to the diagram. You can add all related assets for a selected asset at once. For example, you can add the local components assigned to an application or the applications assigned to an application group.
When you add applications, any information flows between the added applications, as well as between the added applications and those already in the diagram, are added automatically. Depending on the number of added assets and relationships, you may need to rearrange the diagram to improve readability.
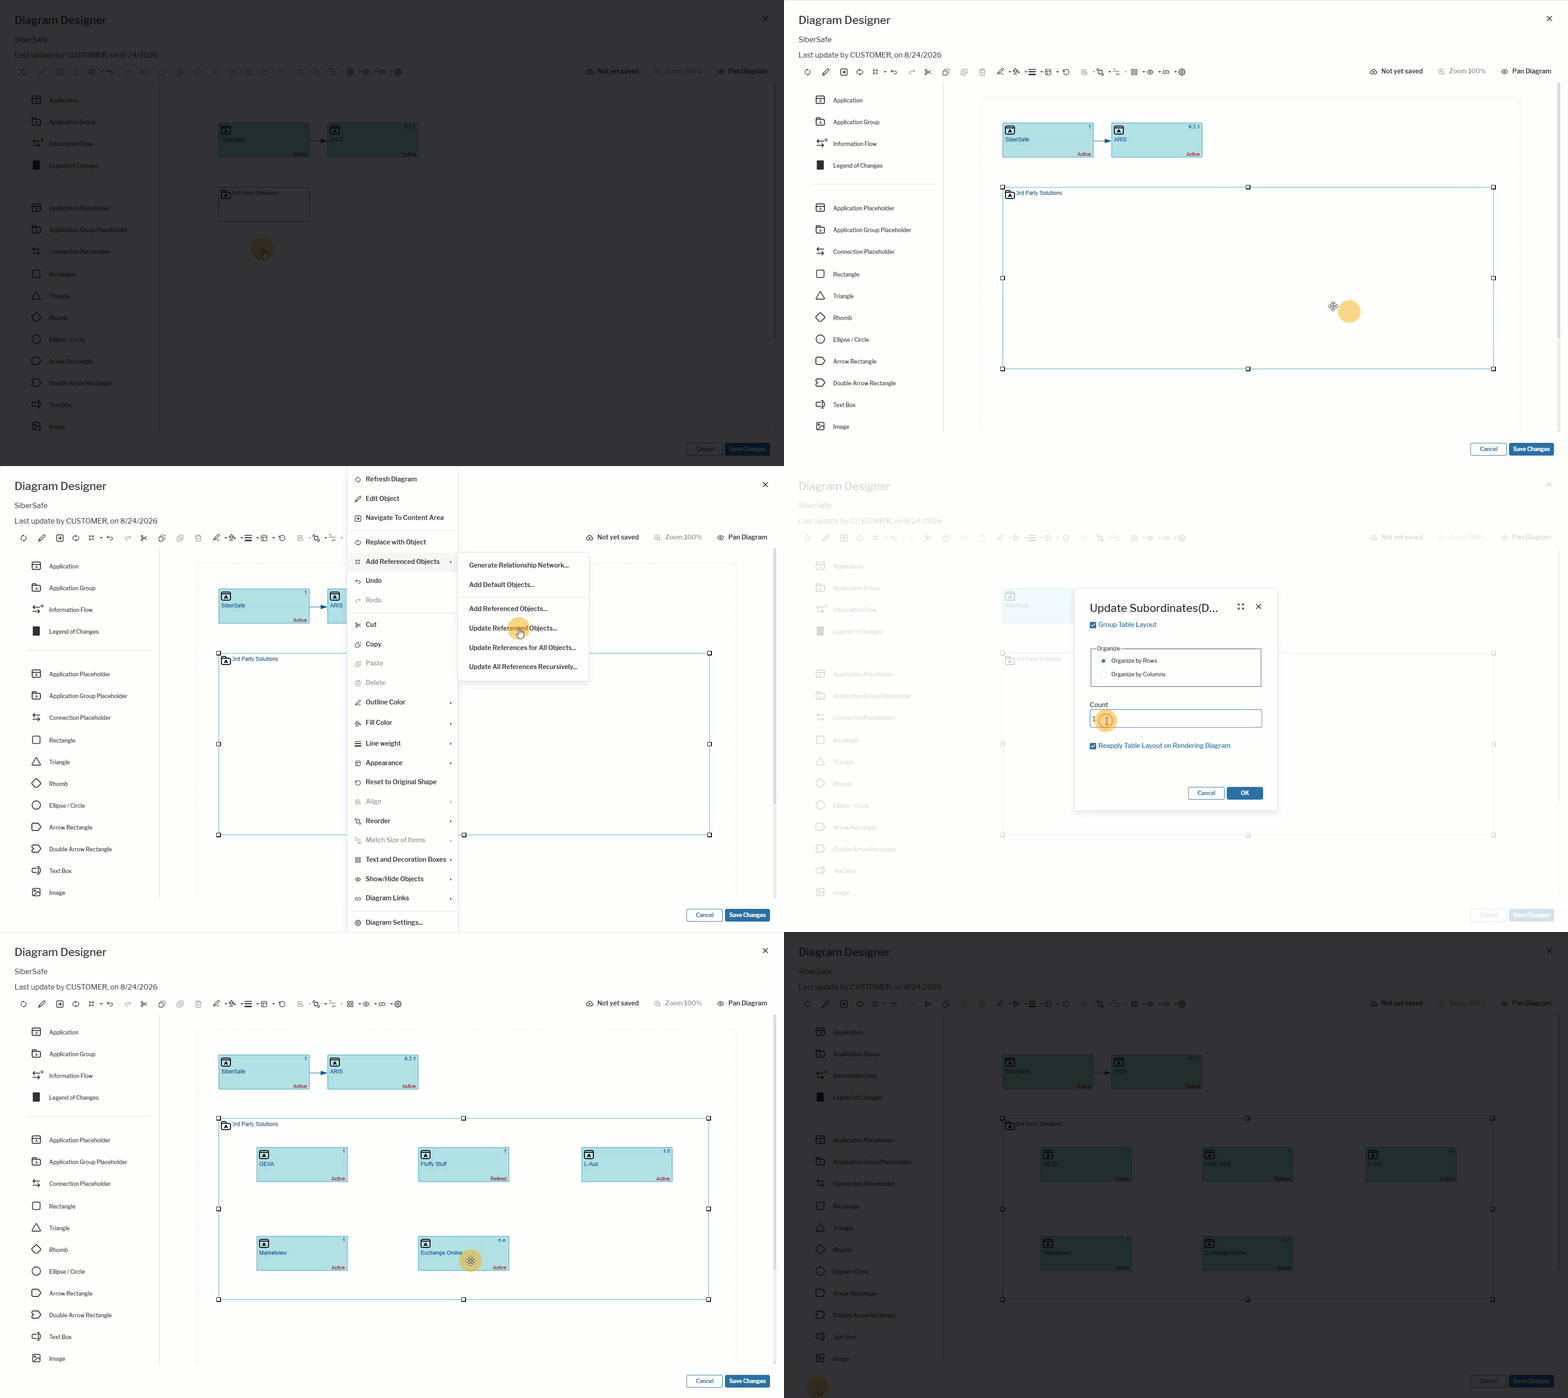 Click here to see how.
Add selected referenced assets to a diagram item. For example, you can add an application's local components or applications assigned to an application group.
- Right-click the diagram item and select Add Referenced Objects > Add Referenced Objects.
- In the selector, choose one or more related assets to add to the diagram.
- Click OK to apply the update.
Add all referenced assets of an asset to a diagram item. For example, add an application's local components or all applications assigned to an application group:
- Right-click the diagram item > Add Referenced Objects > Update All Referenced Objects. An Update Group editor opens where you can define the following:
- Group Table Layout. Select the checkbox to specify the automatic formatting of objects. If you do not select the checkbox, all objects will be placed on top of each other in the diagram and you will need to manually distribute them in the diagram.
- Organize by Rows or Organize by Columns: Select whether assets should be arranged in rows or in columns.
- Count: Enter how many rows or columns should be displayed.
- Reapply Table Layout on Rendering Diagram: Select the checkbox to specify that the layout should be rescanned upon the Update... action. If the checkbox is not selected, the current layout will not be updated with the table layout definition. In this case, the current layout of referenced objects including the positioning or removal of reference objects will not be changed.
- Click OK to apply the update.
Add all referenced assets of all assets currently displayed in the diagram. This option would add all applications to all application groups and all local components to all applications that are already displayed in the diagram.
- Right-click anywhere in the diagram and select Add Referenced Objects > > Update References for All Objects.
- Specify the layout options in the Update Group editor and click OK to apply the update.
Add all referenced assets recursively. This action adds all assets referenced by the assets currently displayed in the diagram, as well as any assets referenced by the newly added assets. The process continues until the lowest level of the hierarchy is reached. All added objects are placed on top of each other and must be arranged manually in the diagram. Use this action with caution, as it can add a large number of assets and relationships and may require significant rework of the diagram layout.
- Right-click anywhere in the diagram and select Add Referenced Objects > Update References for All Objects.
- Specify the layout options in the Update Group editor and click OK to apply the update.
Edit data about an asset in the diagram
You can edit the basic attributes of an asset in the diagram that you have access permissions for. Right-click the diagram item and select Edit Object or select Navigate to Content Areato edit and understand more details about the object.
Hide classes or assets in the diagram
By default, all object classes and relationships defined for a diagram are displayed. You can hide selected information to simplify large or complex diagrams and focus on content relevant to a specific audience. Assets associated with a hidden object class will not be displayed in the diagram for any user accessing the diagram. You can return the object class to the diagram via the Diagram Designer at any time, thus making the relevant objects visible again in the diagram page view.
Hide an object class. All objects of that class and their dependent relationships are hidden. For example, hiding application groups also hides their applications and information flows.
- Right-click in the canvas area and select Show/Hide Objects > View Settings.
- The View Settings editor displays all object classes and relationships that can be hidden in the diagram. Relationships between object classes are indicated by an arrow (-->). For example, Application --> Application indicates information flows from an application to another application, and Application --> Peripheral indicates information flows from an application to a peripheral.
- All object classes and relationships that are currently specified as visible in the diagram are selected. Deselect any object class or relationship that you want to hide in the diagram.
- Click OK. The objects are no longer visible in the diagram.
- Return the object class or relationship to the diagram by setting the relevant object class to visible.
Hide individual objects. The selected object and its dependent relationships are hidden. For example, hiding an Application Group also hides its applications and information flows.
- Right-click the object in the diagram that you want to hide and select Show/Hide Objects > Hide Selected Objects.
- The selected object and its referenced objects are no longer visible in the diagram. Return the object class or relationship to the diagram at any time Show/Hide Objects > Show All Hidden Objects.
Hide all connections for an object. For example, you can hide all information flows for an application while keeping the application visible in the diagram.
- Right-click the object in the diagram that you want to hide and select Show/Hide Objects > Hide Connections for Objects. The connection items associated with the selected object are no longer visible in the diagram.
- Return the connection items to the diagram at any time via Show/Hide Objects > Show Hidden Connections for Objects.
When you use the Generate Network functionality, related objects and connection items are added to the diagram even if their object classes are currently configured to be hidden. This behavior ensures that the generated network is complete and that you can review all objects and relationships identified by the operation. After the network is generated, you can hide the added objects and connections using the diagram visibility options described above.
Remove assets from the diagram
The Alfabet Diagram Designer provides a Delete  and Cut
  capability in the toolbar and right-click menu.
- The Delete button allows you to delete an information flow that has been created in the context of the Alfabet Diagram Designer. The information flow will be irrevocably deleted from the repository.
- The Cut button allows you to remove any asset as well as shapes that have been added to the diagram. Any assets that have been removed via the Cut button are saved to a clipboard and can be returned to the diagram via the Paste
 button.
The Cut
button will be disabled if you select an information flow. Information flows can only be removed if a source or target application is removed from the diagram via the Cut button.
Add shapes to the diagram
You can add any shape available in the toolbox of the Diagram Designer. After adding a shape, you can modify its position, size, appearance (for example, color, border, or shadow), and text.
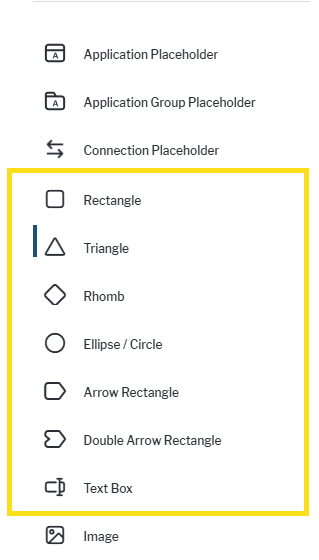
To add a rectangle, triangle, rhombus, ellipse/circle, arrow rectangle, double arrow rectangle, or text box:
- In the toolbox, select the required shape to add it to the canvas area. A vertical bar is shown next to the shape if it is selected.
- Drag the shape to the diagram.
- The shape is first displayed as a text box where you can enter text.
- Click in the text box and enter text.
- Click anywhere outside the text box. The shape is displayed with the text.
-
Change the look of the diagram items and shapes, as needed.
If you have added a triangle, drag the adjustment handle to change the direction of the triangle's apex (tip).
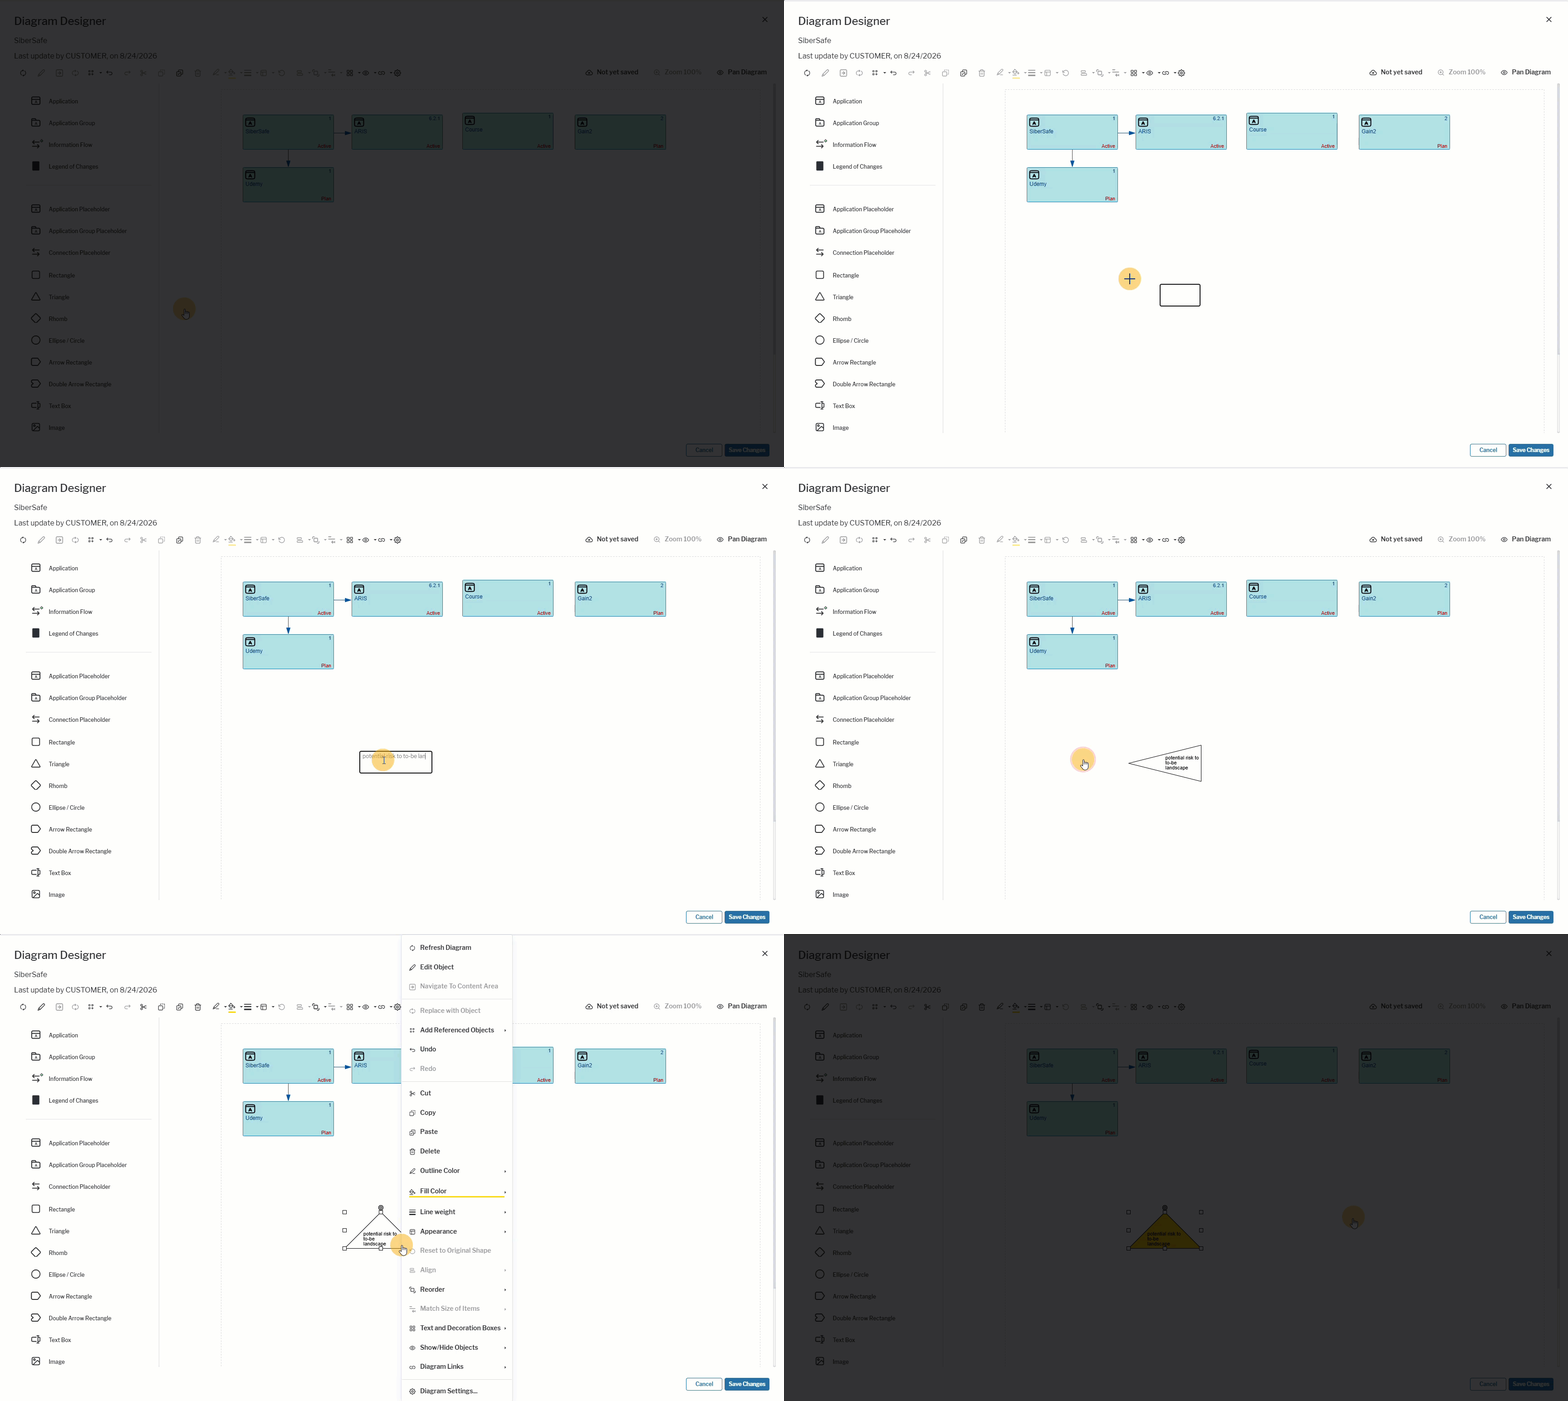 Click here to see how.
Change the look of diagram items and shapes
Various options are available that allow you to change the visual style of your diagram. When you select one or more diagram elements or shapes in the diagram and right-click, you will see the design options that are available for your selection. Note that you must save each change via the Save Changes button in the lower left corner.
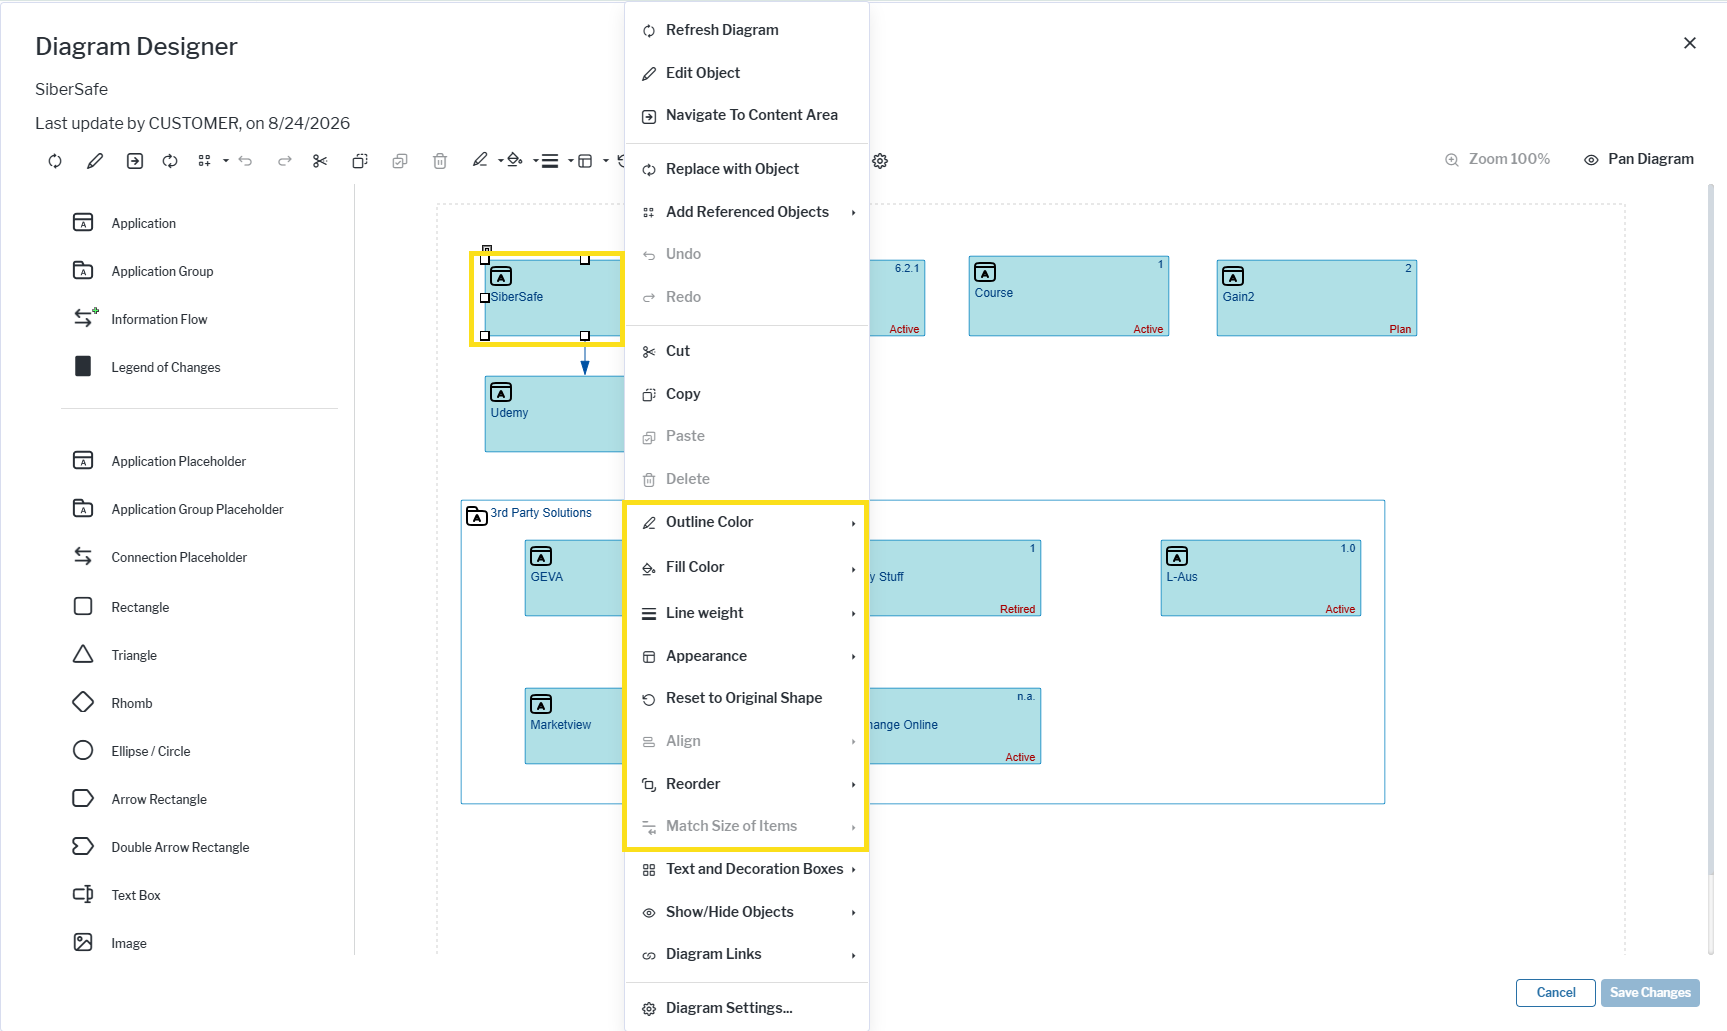
- Move a diagram item or shape to another position in the diagram. Click on the diagram item or shape so that all handles are displayed. Drag the diagram item or shape to the position you desire.
- Change the size of a diagram item or shape. Drag the handle of the diagram item or shape to the size you desire.
- Select multiple items at once to efficiently apply visual changes to the diagram. Drag the mouse around multiple diagram items to create a selection area. All objects within the selected area will be included in the selection. Diagram items can be individually added to the selection by holding the CTRL key while clicking.
- Add color to a diagram item or shape with color. Select one or multiple diagram items and right-click > Fill Color to choose a color from the palette. Select Outline Color to specify the color of the border of the diagram item. You can also select Outline Color to change the color of connections..
- Change the line weight of borders and lines. Select one or multiple diagram items or connections and right-click > Line Weight. Select a weight for the border or connection and define whether it should be solid, dashed, or dotted.
- Bring a diagram item or shape forward or backward. Select the diagram item or shape you want to move and right-click > Reorder . Select Bring to Front or Send to Back.
- Align diagram items and shapes. Click and drag the mouse to select multiple diagram items or press the CTRL key and select the diagram items and shapes that shall be aligned. Right-click > Align to align the selected diagram items and shapes or distribute them horizontally/vertically.
- Match the size of diagram items and shapes. Click and drag the mouse to select multiple diagram items or press the CTRL key and select the diagram items and shapes whose sizes shall be changed. Right-click > Match Size to specify how to change the size for all selected items.
Add text to the diagram
You can add a text box to a diagram item like an application to provide additional information or add a text box as an independent item in the diagram. This allows you to add more structure and detailed information to the diagram.
Add a text box to a diagram item. Right-click the diagram item and select Text and Decoration Boxes > Add Text Box. Click in the text box and enter text. The text box will increase in size.
Add a decoration box to a connection. The decoration box is linked to the selected connection item by a connector line. Right-click the connection item and select Text and Decoration Boxes > Add Decoration Box. Click in the decoration box and enter text. The decoration box will increase in size.
Change the font size, style, and alignment of the text. Right-click the text or decoration box and select Text and Decoration Boxes > Edit Text Attributes. Specify the fields as needed and click OK.
Rotate a text box. You can rotate the text box 90°. Right-click the text box and select Text and Decoration Boxes > Rotate Box. Upon the first click the text box rotates 90° to the left of its original position. Select the option two more times to rotate it 90° to the right of its original position.
Add an image to the diagram
You can add an image as a PNG or JPG file to the diagram. The graphic image is added to the diagram based on its original size.
To add an image to the diagram
- In the toolbox, drag the Image element to the canvas area.
- In the editor that opens, click Select File, choose the file to add, and click OK.
- Drag the handle of the image to the size you desire.
- Click the Save Changes button.
Adding a link to another diagram
Assets displayed in a diagram may provide linkage to other diagrams. Only one diagram may be linked per diagram item and only diagram types that are permissible for the selected diagram item may be specified. If a diagram item has a link to another diagram, the user can click the dark blue Navigate arrow on the lower-right corner of the diagram item. The name of the target diagram and its base object will be displayed in the tooltip for the Navigate symbol. Please note that navigation to diagrams is not supported for connections.
- Right-click the diagram item and select Diagram Links > Add Link to Another Diagram.
- In the selector, select a diagram type in the Select Diagram Definitionfield. Only diagram types that are permissible for the selected node will be displayed.
- Select the relevant diagram as the navigation target and click OK.
- To remove the diagram navigation definition from the node, click Diagram Links > Remove Diagram Link.
Adding a legend of the diagram’s change history to the diagram
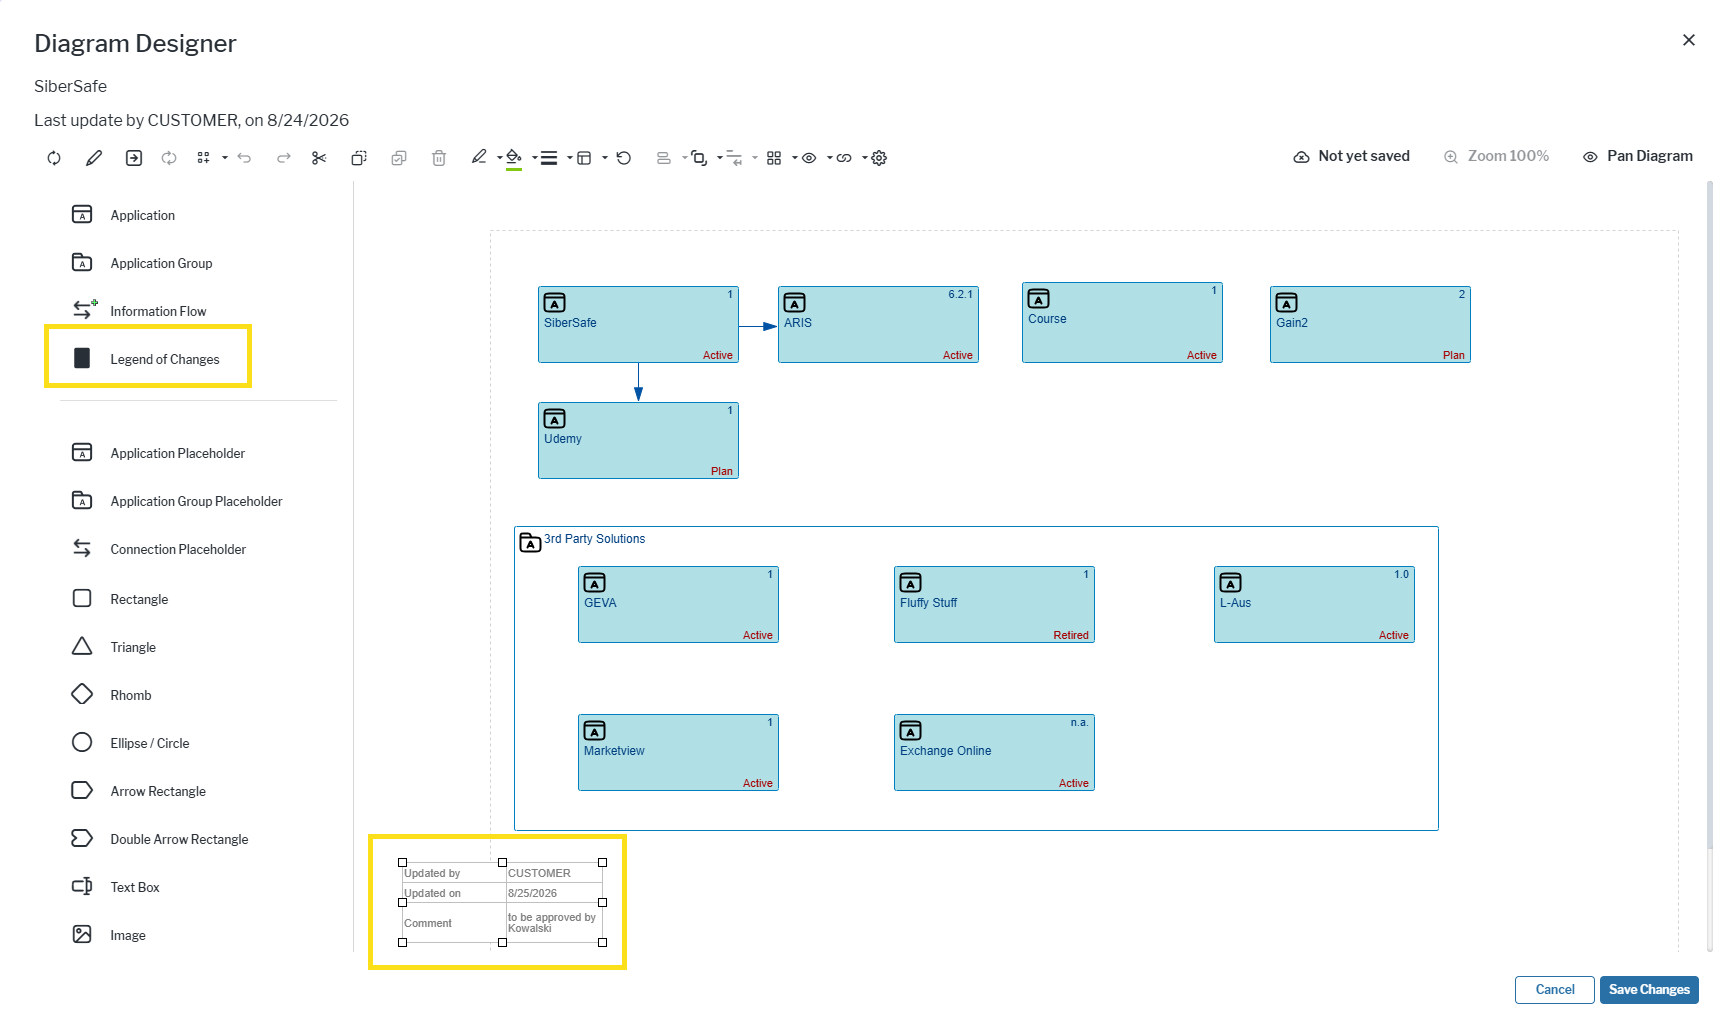
You can add a legend to a diagram in order to capture the name of the user who last modified the diagram, the date of the modification, and a comment. The legend can be placed anywhere on the diagram and will then be displayed on the diagram in the Diagram Designer as well as on the diagram displayed in the relevant page view in the user interface.
To create a legend for the diagram
- In the toolbox, drag the Legend of Changes element to the canvas area.
- The login name of the user working on the diagram as well as the current date are automatically added to the legend. These will be automatically updated when the diagram is modified in the future.
- Double-click the legend to open a text editor. Enter text providing relevant information about the modification to the diagram and click OK. You can edit the comment at any time by double-clicking the legend.
- Click the Save Changes button.
Undo your changes
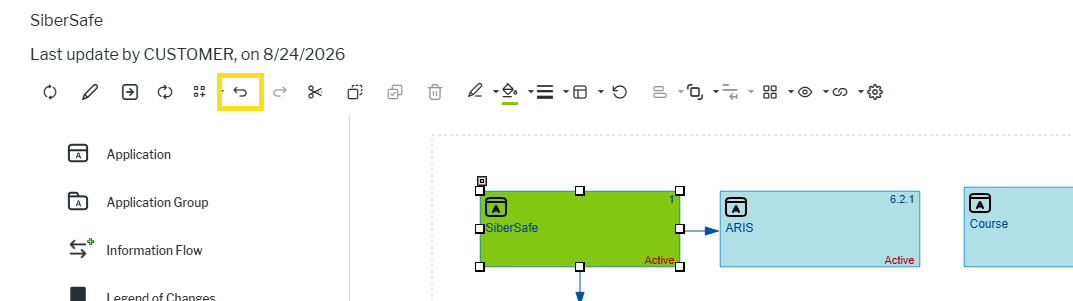
In the toolbar, the  Undo button and
  Redo button let you revert the diagram to a previous state or return the unsaved changes in the diagram. This lets you experiment so that you can revert to a different layout or coloring of diagram items. the Undo functionality cannot used after the Save Changes button.
The Undo button cannot be used to remove an information flow that you created in the context of the diagram. The information flow must be deleted if you no longer want it in the diagram.