Set up the portfolio chart

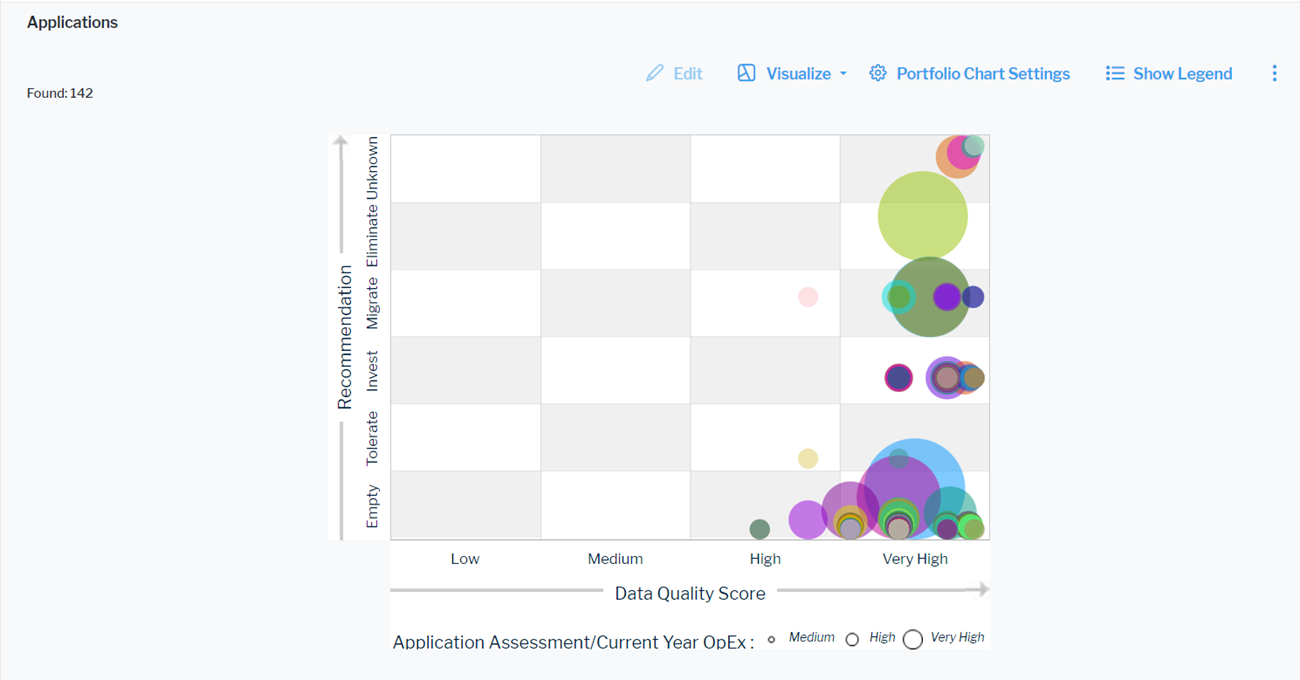
Click Visualize > Portfolio Chart. Click Portfolio Chart Settings to set up the portfolio chart.
The assets visible in the visualization are based on the definition made in the data table. To add or remove assets, click Visualize > Data Table. Click the Structure button to change the content. Click to learn more about how to specify the data you want to see.
- X-Value Column: Select an attribute to show as the value on the X-axis.
- Y-Value Column: Select an attribute as the value on the Y-axis.
- Power Value Column: Select a numeric attributes to specify the size of the bubbles in the portfolio chart.