Define analytics dashboards
Alfabet provides analytics dashboards that are based on the embedded third-party tool DevExpress® Dashboard. Analytics dashboards support end users to create ad-hoc information-rich data visualizations. Users can use the full range of visualization possibilities available in the DevExpress Dashboard Designer. Add one or more dashboard items such as charts, scatter charts, grids, cards, gauges, pivots, range maps, tree-maps to the analytics dashboard and leverage filtering options such as combo-boxes, list boxes, and tree views.

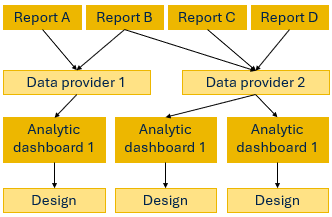
An analytics dashboard is based on a data provider which consists of one or many pre-configured reports or database views that provide data from the Alfabet database in a table structure. The data from the reports or database views can then be used to design the analytics dashboard. As the dashboard designer, you can select the visualization type, specify the data from the data provider that shall be visualized, and design the layout of the dashboard.

The following steps are required to define the analytics dashboard:
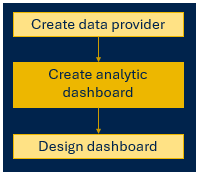
- Create the data provider, selecting one or multiple reports containing the required information.
- Create the analytics dashboard, selecting a single data provider and deciding about the visibility of the view to end users.
- Design the analytics dashboard.
Analytics dashboard definitions offer extensive flexibility in design. A tabular report can be used in multiple data sources and the same data source can be used to create multiple analytics dashboards, each one analyzing a different aspect of the data source.
Once you have designed the analytics dashboard and shared it with user, these users can add the dashboard as dashboard page to class-independent content areas (like Home) via the 'Add Dashboard Page' interaction in the three-dots menu of the content area. When the user adds a dashboard page to a content area, the dashboard is visible with predefined content, but not editable. Users cannot share the tab they added as dashboard page with other users.
Dashboard pages have a different an icon in the content area tab to destinguish them from content pages. In class-independent content areas, tabs for dashboard pages show a  icon.
icon.
Analytics dashboards are not compliant with the dark mode for rendering the user interface.