
The business question What is our investment landscape? provides insight about the organization's business capabilities and the demands and projects that impact them. The nested matrix visualization exposes overlaps and redundancies of investments and helps to eliminate waste and improve coherence. With this business question, prioritization becomes more rational and transparent, ensuring that resources are directed toward the initiatives that most effectively enhance the company’s ability to compete and execute its strategy. By understanding which initiatives strengthen critical business capabilities, your company can focus investment where it creates the greatest long-term value and ensure alignment with strategic priorities.
The license package Strategic Portfolio Management is required to work with this business question. The use case Project Portfolio Governance must be activated.
Navigate to What is our investment landscape?
Use the method that is most convenient for you:
- In the left navigation panel, enter What is our investment landscape? in the Search Navigation field.
- In the left navigation panel, click Home. In the content area, go to the Business Questions page and click the tile for What is our investment landscape?
- In the left navigation panel, expand the sections Business Questions and Transformation and click What is our investment landscape?
What information is displayed in What is our investment landscape?
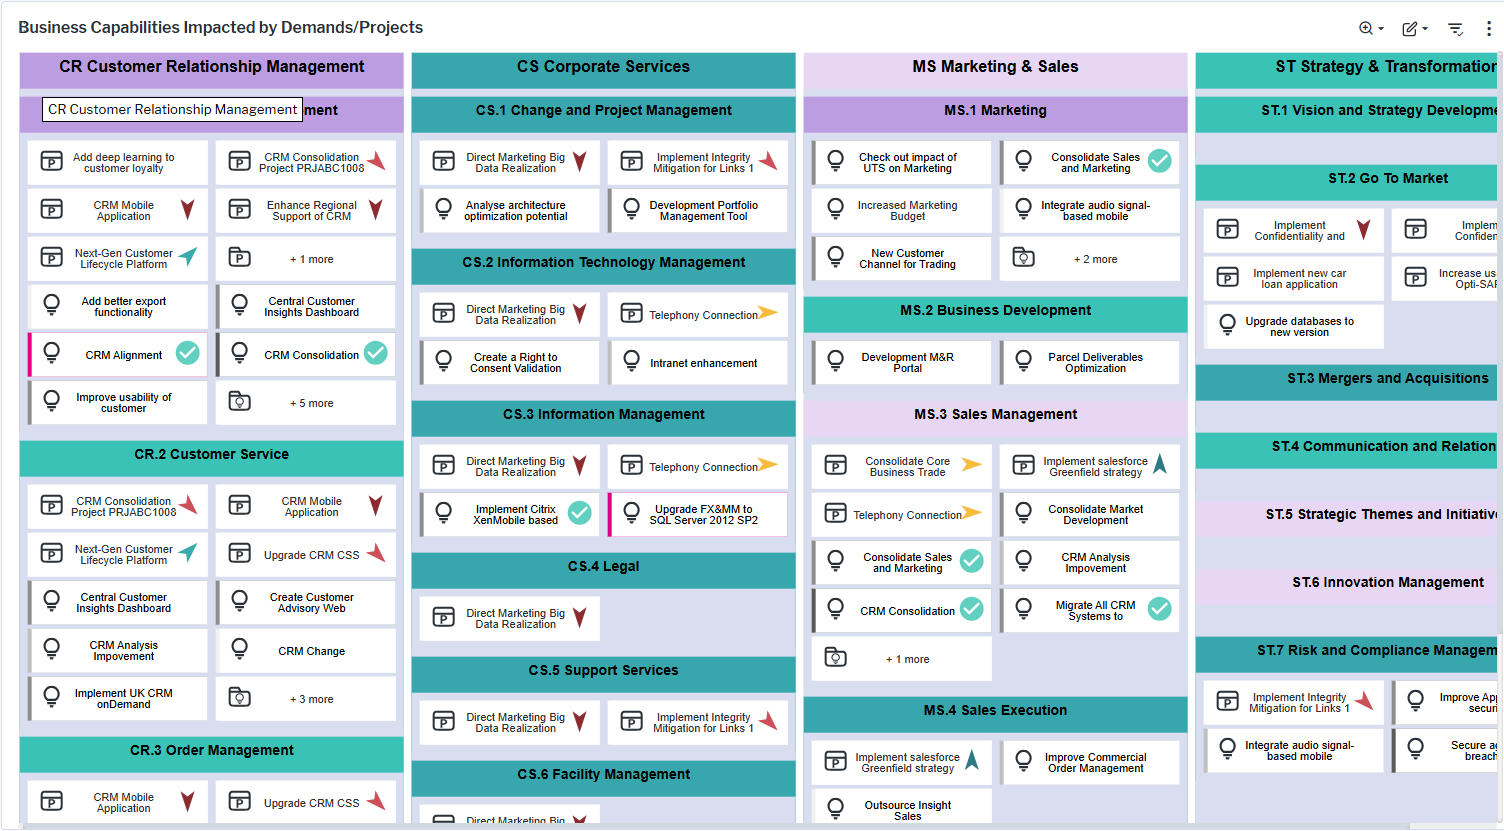
The view is a nested matrix that shows the business capability model with information about the demands and projects that impact the business capabilities including project and demand KPIs such as strategic value or cost savings potential. Here's how to interpret the information:
- Each business capability is represented by a nested box in the matrix.
- The levels of business capabilities in the business capability hierarchy are specified via the
 local filter button > Aggregate on Business Capability Level. Each business capability is colored according to its hierarchy level.
 - Projects
 and demands
  that impact the business capability are displayed inside the nested box representing the business capability. The business capability has been specified as part of the project's affected architecture or the demand's affected architecture.
 - Demands are colored based on their priority. The color range indicates light grey as low priority and red as high priority.
- Demands with projects defined will show a green checkmark
 . Click the checkmark to view more details about the project.
 - If there are more than 11 projects and demands for the business capability, an element will show how many projects/demands are not displayed in the matrix. Double-click the element to open a data workbench showing a complete list of projects and demands associated with the business capability.
- To hide business capabilities in the matrix that have no projects or demands, enable Show Only Business Capabilities with Projects/Demands filter.
- Projects and demands can be aggregated to business capabilities at the second or third hierarchy level using the Aggregate on Business Capability Level filter. For example, selecting 2 aggregates projects and demands from third- and fourth-level business capabilities to their respective parent capabilities at the second level, providing a higher-level view of investments and demand distribution.
- Projects may be colored based on the Color Rule field and indicators may be added for applications via the Show Project KPI field. A Show Demand KPI setting is also available. Click the
 3-dots button > Show Legend to understand the color coding.