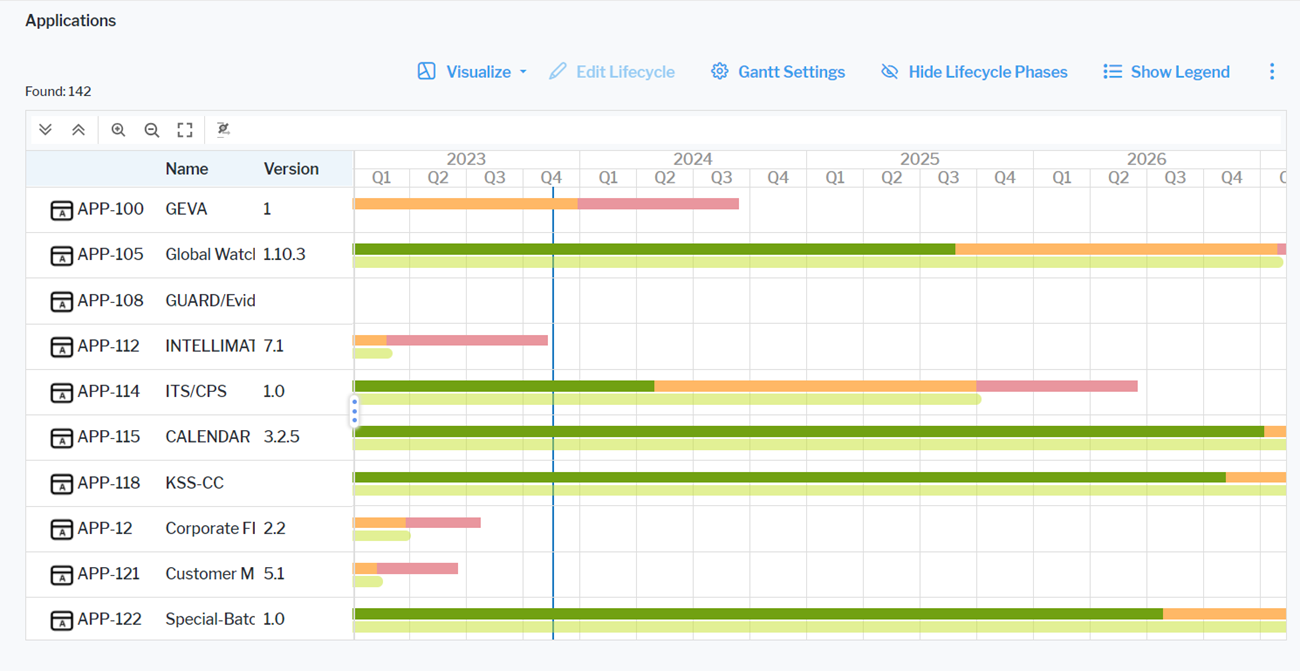
Set up the Gantt chart

A Gantt chart is only meaningful for assets based on classes that have start and end dates, a lifecycle with lifecycle phases, or other date attributes.
A Gantt chart displays assets on a timeline. If both start and end dates and lifecycle phases are defined, the timeline for start and end date is displayed beneath the timeline for the lifecycle phases. Click Hide Lifecycle Phases to show only the timeline with the start and end dates.
The assets visible in the visualization are based on the definition made in the data table. To add or remove assets, click Visualize > Data Table. Click the Structure button to change the content .Click to learn more about how to specify the data you want to see.
-
Define the time schedule settings:
- Calendar Unit: Specify whether to display the timeline in years, quarters, months, or weeks.
- Start with Current Year: Select if the current year shall be the start year of the Gantt chart. To focus on a different timeframe, define a specific start year in the Calendar Start Year and end year in the Calendar End Year fields.
-
Define the display of information about the assets:
- Column Caption: Specify a caption for the column displaying the asset information.
- Object Attributes to Display: Select the attributes to display for the assets. You can either have each attribute displayed in its own column or select the Object Attributes in One Column checkbox to display them in only the first column.
If attributes are not displayed, they may be hidden because the field for the attributes is too small. Increase the size of the field to see all attributes.
- Attribute for Start Date and Attribute for End Date: Define the date attribute to use to determine the start and end dates of the bars in the Gantt chart.
- Relevant only for Gantt charts showing project data: Show Enterprise Milestones: Set a checkmark to display project milestones. To create project milestones for a project, select a project to navigate and go to Monitoring > Project Milestones.