Set up the portfolio chart
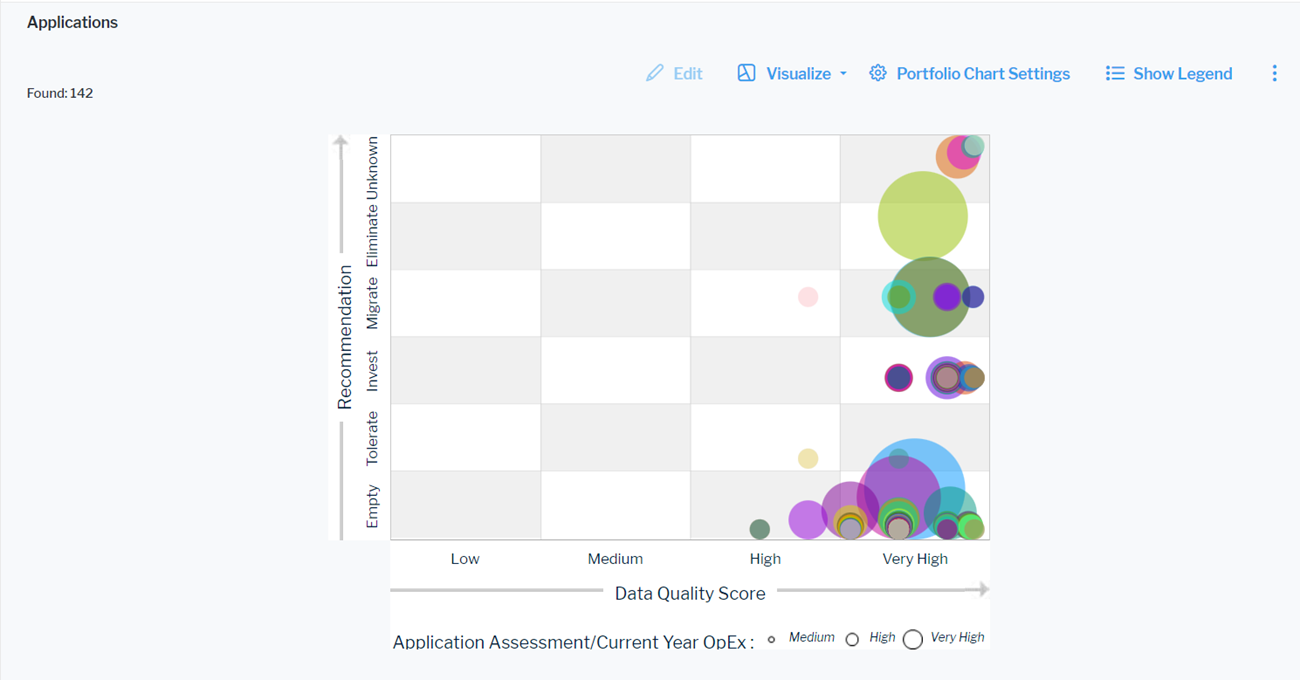
Click Visualize > Portfolio Chart. Click Portfolio Chart Settings to set up the portfolio chart.
The assets visible in the visualization are based on the definition made in the data table. To add or remove assets, click Visualize > Data Table. Click the Structure button to change the content. Click to learn more about how to specify the data you want to see.
- X-Value Column: Select an attribute to show as the value on the X-axis.
- Y-Value Column: Select an attribute as the value on the Y-axis.
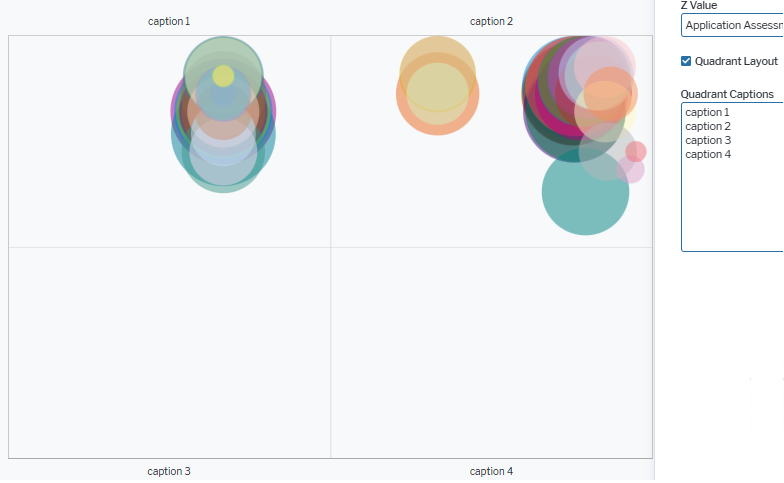
- Z-Value Column: Select a numeric attribute to specify the size of the bubbles in the portfolio chart.
- Quadrant Layout: Select the checkbox if you want to display the portfolio in a quadrant layout except of a portfolio with value axes.
-
Quadrant Captions: If you have selected the Quadrant Layout checkbox, define the captions of the quadrants. Captions are separated by new lines. The definition starts with the upper captions followed by the lower captions from left to right:
If you select an indicator with a range definition to be displayed on the x-axis or y-axis, the order of values from left to right or from bottom to top is identical to the order of values defined for the range of the indicator. The values may be sorted from lower to higher or higher to lower values, depending on the indicator definition.