
Bizzdesign logo
  • Contact us
    Alfabet Support Hopex Support Horizzon Support Unify Support
  • Bizzdesign Community
  • Bizzdesign University
  • Bizzdesign
 
  1. Alfabet help
  2. Welcome to Alfabet
  3. Add a visualization to the content repository
  • Welcome to Alfabet
  • Learn the basics
    • Log in to Alfabet
    • Change your password
    • Set your default user profile
    • Specify the color theme for your user interface
    • Specify your email address and picture
    • Change the language of the interface
    • Render your data in compact mode
    • Overview of the user interface
    • Navigate through the user interface
    • Navigate via keyboard through the user interface
    • Search for your data
    • Search for a data workbench or business question
    • Save your favorites
    • Communicate with your colleagues
    • Share content with your colleagues
    • Share a URL with your colleagues
    • Store your user context settings
    • Save your data
    • Export your data
    • View your notifications
  • Understand access permissions
    • User profiles
    • Authorized users and user groups
    • Roles
  • Maintain and plan your IT architecture
    • Methodology and the class model
    • Data capture and maintenance
    • Improve the quality of your data
    • Data analysis with business questions
  • How to use data workbenches
    • Define the data you want to see
      • Add and remove columns
      • Filter the data in the data table
    • Create and edit existing data
    • Visualize your data in reports and business charts
      • Set up your business charts
      • View preconfigured reports
      • Add a visualization to the content repository
  • How to use content areas
    • Edit data in a content area
    • Change content areas to your advantage
      • Set filters for a content area
      • Add or remove content in a page in a content area
      • Save content to the content repository
      • Change the settings for a content item
      • Change the size of a content item in a content page
      • Change the order of content items in a content page
      • Add a new content page to a content area
      • Remove a view from a content page
      • Remove a page from the content area
      • Delete a content page
      • Export a content page
      • Restore the default content page
      • Share content with your colleagues
      • Manage your content repository
  • Understand workflows
    • Trigger a workflow
    • Take care of your workflow activities
  • Design diagrams visualizing your IT landscape
    • Define diagram settings
    • Quick guide: Build diagrams with the Diagram Designer
    • Design an application landscape diagram
    • Design a BPM diagram
    • Design Archimate diagrams
    • Change the layout and styling of flow reports and network diagrams
  • How to design and manage storyboards
    • View your storyboards
    • Create and manage storyboards for your user community
      • Create a storyboard
      • Design the storyboard
      • Specify access to the storyboard
  • Complete your data collection tasks
  • Get help if you're lost

Add a visualization to the content repository

Store a visualization in the content repository and add it to a content area as a content item and save the current visualization settings persistently for future use. The content item will show current data for the range of assets which you analyzed when you created the visualization. You can share the saved content item with other users.

Users can drill-down to a data workbench by clicking a section of a business chart such as a slice of a pie or doughnut chart or bar of a bar chart. A data workbench showing the assets represented by the business chart section will open in a separate browser tab.

  1. Go to the data workbench and specify the visualization you want to save. You can save the data workbench with filters settings or you could save a visualization such as a Gantt chart or pie chart derived from the data workbench. Learn more about how to define the data you want to see in a data workbench.
  2. Once the data workbench visualization is specified, click the ThreeDots 3-dots button three-dot menu of the visualization and click Add to Content Repository.
  3. Define a name and a description for the visualization. The configuration name is used in the content area as caption for the visualization.
  4. Specify the users or user groups to share the content page with. The content item will be available in the selected user's content area via the ThreeDots 3-dots button three-dot > Add to Content Repository. Learn more about how to design and use content areas.
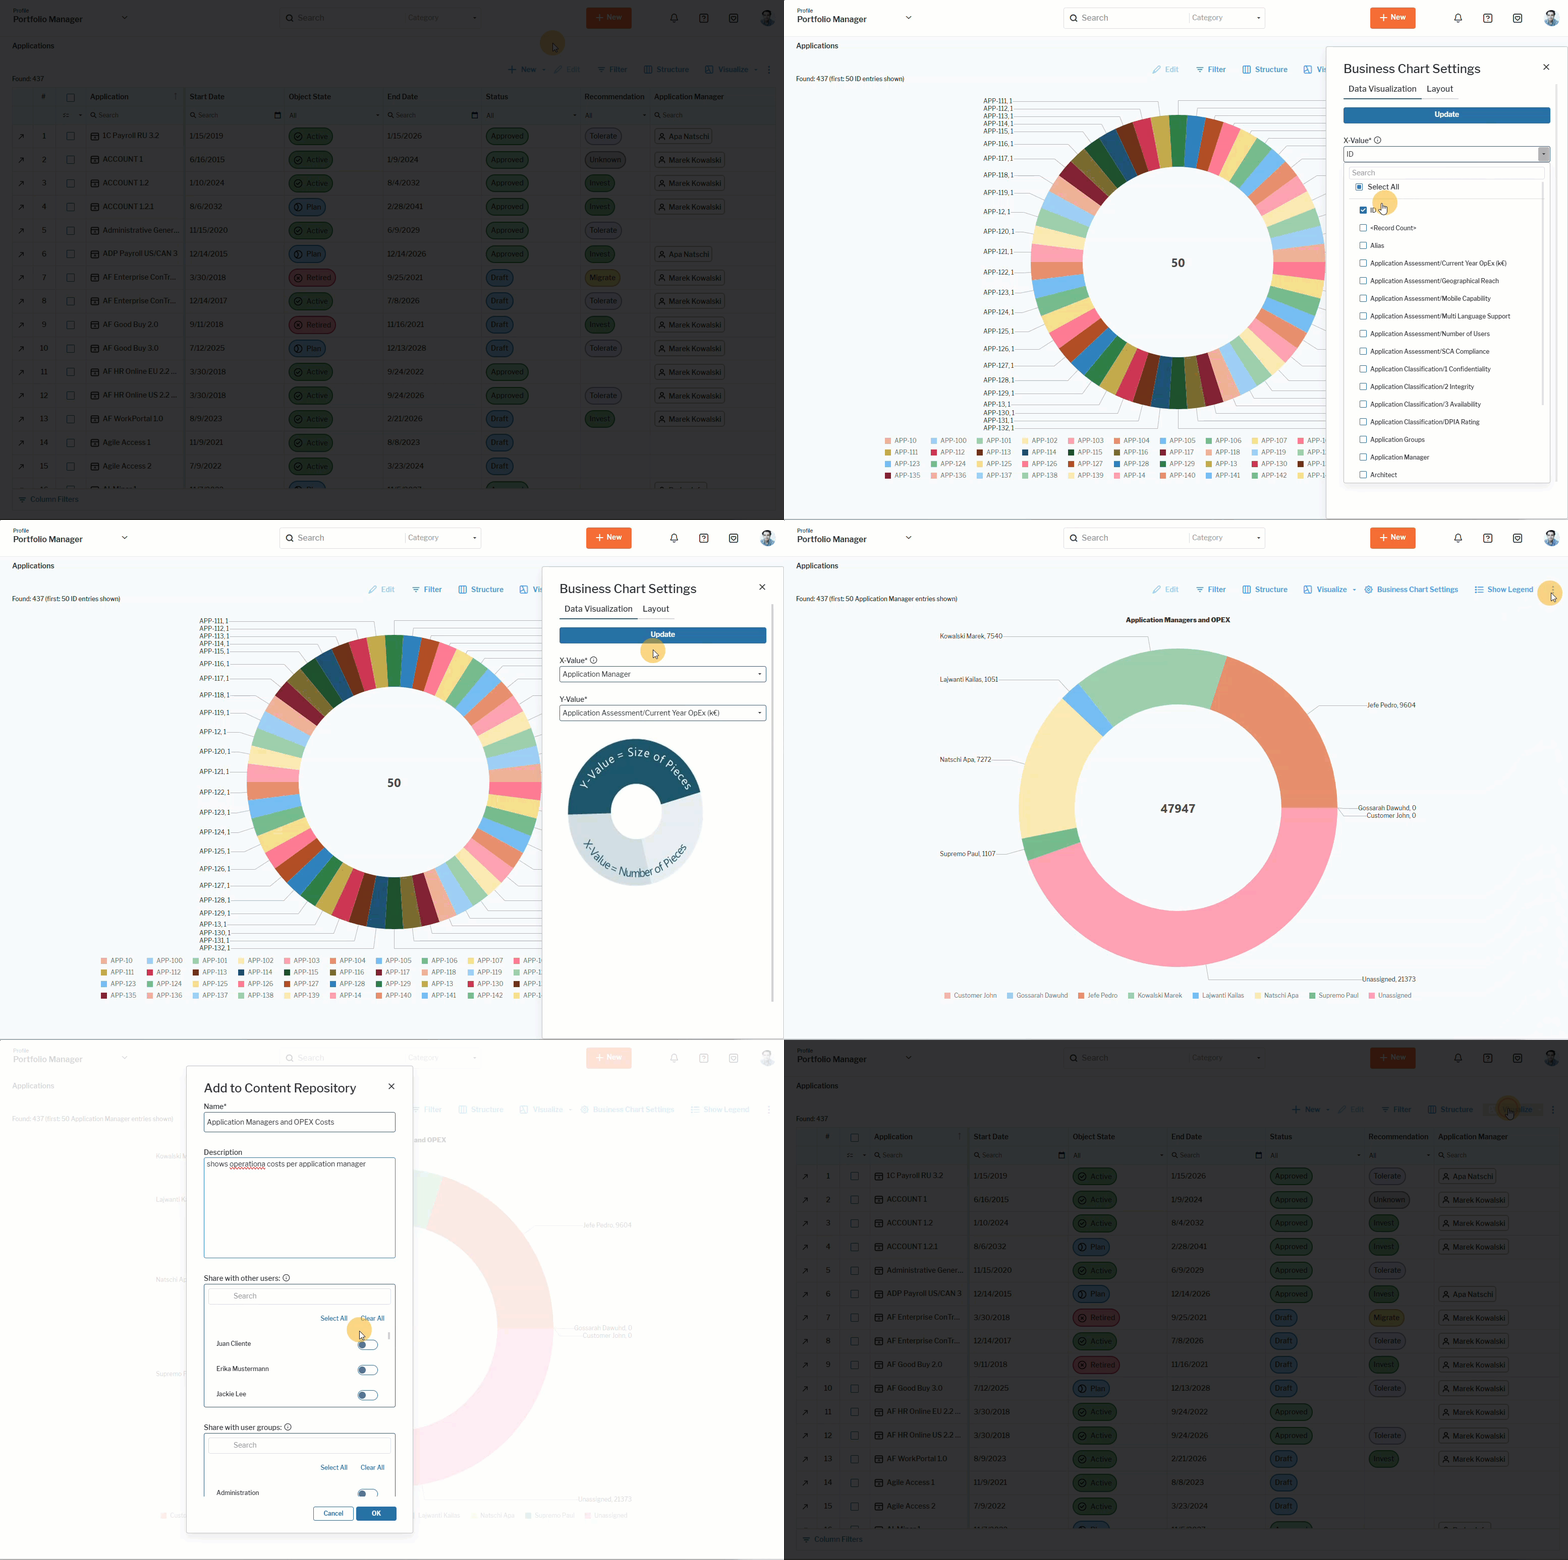
Click here to see how. 

Alfabet Resources

  • Support
  • Learning Portal
  • Downloads
  • Announcements
  • Release Lifecycle
  • Cloud Availability

Support

  • Alfabet Help
  • Hopex Help
  • Horizzon Help
  • Unify Help
  • Knowledge Base

Resources

  • Bizzdesign Community
  • Courses and E-learning
  • Blog Articles
  • Events & Webinars
  • Resource Center

Company

  • Bizzdesign
  • Alfabet Support Policy
  • Hopex Support Policy
  • Privacy Policy
  • Code of Ethics
  • Legal Notices

Copyright © Bizzdesign