Understand the visualization of the meta-model
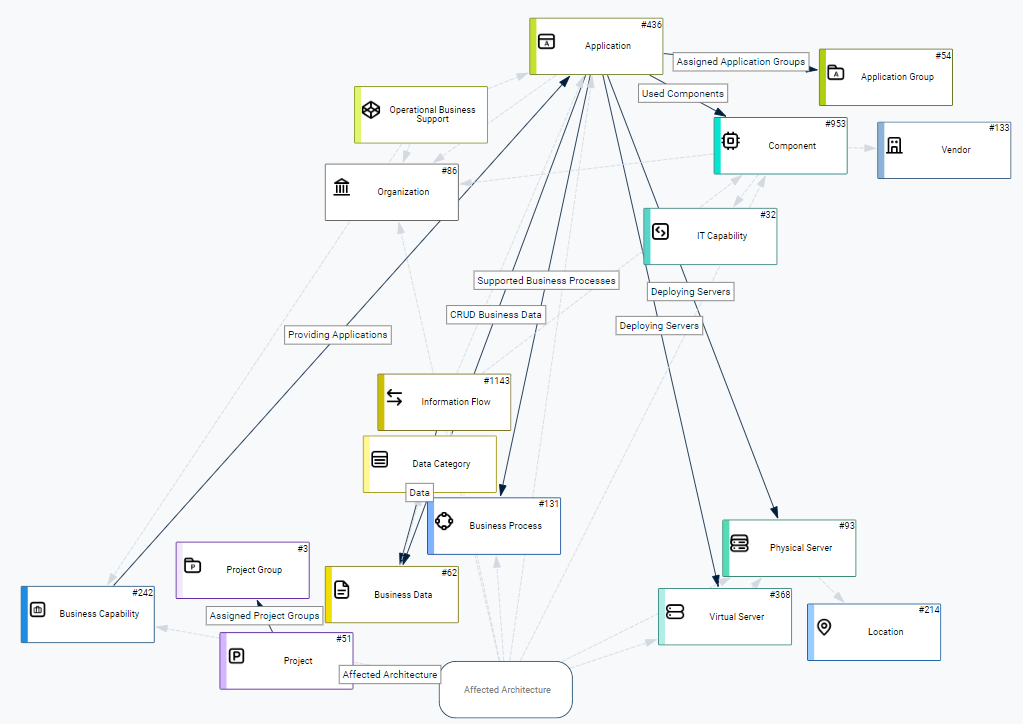
The Data Roundtrip view provides an provides an easy-to-use overview of the meta-model and how the object classes in Alfabet FastLane stand in relation to each other. This is your first stop to understand the meta-model and the relationship between the object classes.
In addition to visualizing the meta-model or a subset of the meta-model, the Data Roundtrip view is where you can export XLSX files for visualized classes and references that you want to capture data for as well as import the XLSX files with the data.

In the left navigation panel, click Data Import > Data Roundtrip. Typically no filters are set and the entire meta-model will be displayed when you first open the Data Roundtrip view. This information is interesting in order to understand the overall picture how classes relate to each other as well as the classes and references for which you can import data.
Many different layout formats are available via the Filter button so that you can adjust the display of the meta-model information to suit your screen and information needs.
Typically you will want to adjust the visualization so that you can focus on the subset of the meta-model that is of interest to you. You can set filters to see the classes that are relevant for a business question or just the classes you are interested in. References between the classes will be automatically included as arrows in the visualization.

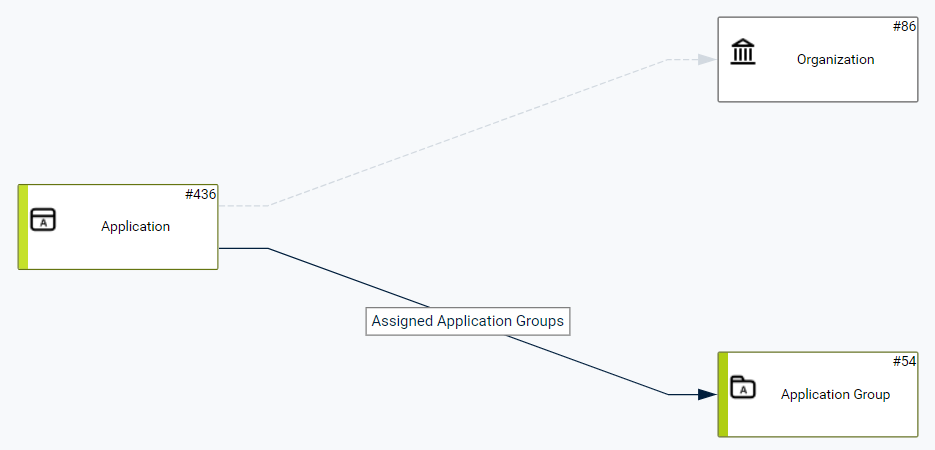
In the image above, the Object Class filter was set to show the classes Application, Application Group, and Organization.
These are the diagram elements you might see in the Data Roundtrip visualization:
 |
Rectangular diagram elements represent object classes. The class icon and object class name is displayed on the diagram element. The number in the upper right corner indicates how many objects of that object class are currently in the database. An XLSX file can be generated for this kind of diagram element in order to capture data for objects in the object class. |
 |
A solid dark arrow diagram element represents a reference between two object classes. The reference between the object classes is described in a box on the arrow. In the image above, the reference starts with Application and points to Application Group and shows the label Assigned Application Groups. An XLSX file can be generated for this kind of diagram element in order to capture the data describing the relationships between objects of the two object classes. |
 |
A light dashed arrow diagram element also represents a relationship between two object classes. Point to the dashed arrow to display a hint describing the reference. In the image above, the relationship starts with Application and points to Organization. The tooltip shows a label Business Owner/IT Owner, whereby applications have organizations that own the application.The dashed arrow is for informational purposes only. Typically the relationship information is captured in the context the XLSX file generated for one of the object classes. An XLSX file cannot be generated for this diagram element. |