The following is introduced to the Alfabet solution configuration this release.
Publish documents about your applications and projects
A new Application Overview Publication report is available in the application content area > Overview page. Users can drill down to the view, publish, and download a complete, well-structured document that shows a variety of indicators and statistics about the current application as well as the most relevant views showing detailed information about the application's business, information, and technology portfolios. The Word file includes a detailed table of contents that structures and makes it easy to find information.
Also the Program Monitoring Summary report available in the program content area > Monitoring page has been updated to showcase how to make a publication for multiple assets.
These publications are delivered as example configurations based on the Alfabet Publication Framework.
Dashboards for project benefits and application portfolio
Two predefined analytical dashboards are available and can be added to a content area via the Add Dashboard Page option.
New Finance Dashboard to show financial metrics of the project portfolio. A new analytical dashboard labelled Finance Dashboard provides a consolidated financial view across the project portfolio by aggregating financial data from all relevant projects. It leverages the detailed monthly figures maintained in the Benefit Tracking and Benefit Realization views, enabling users to analyze financial performance through a single, centralized dashboard.
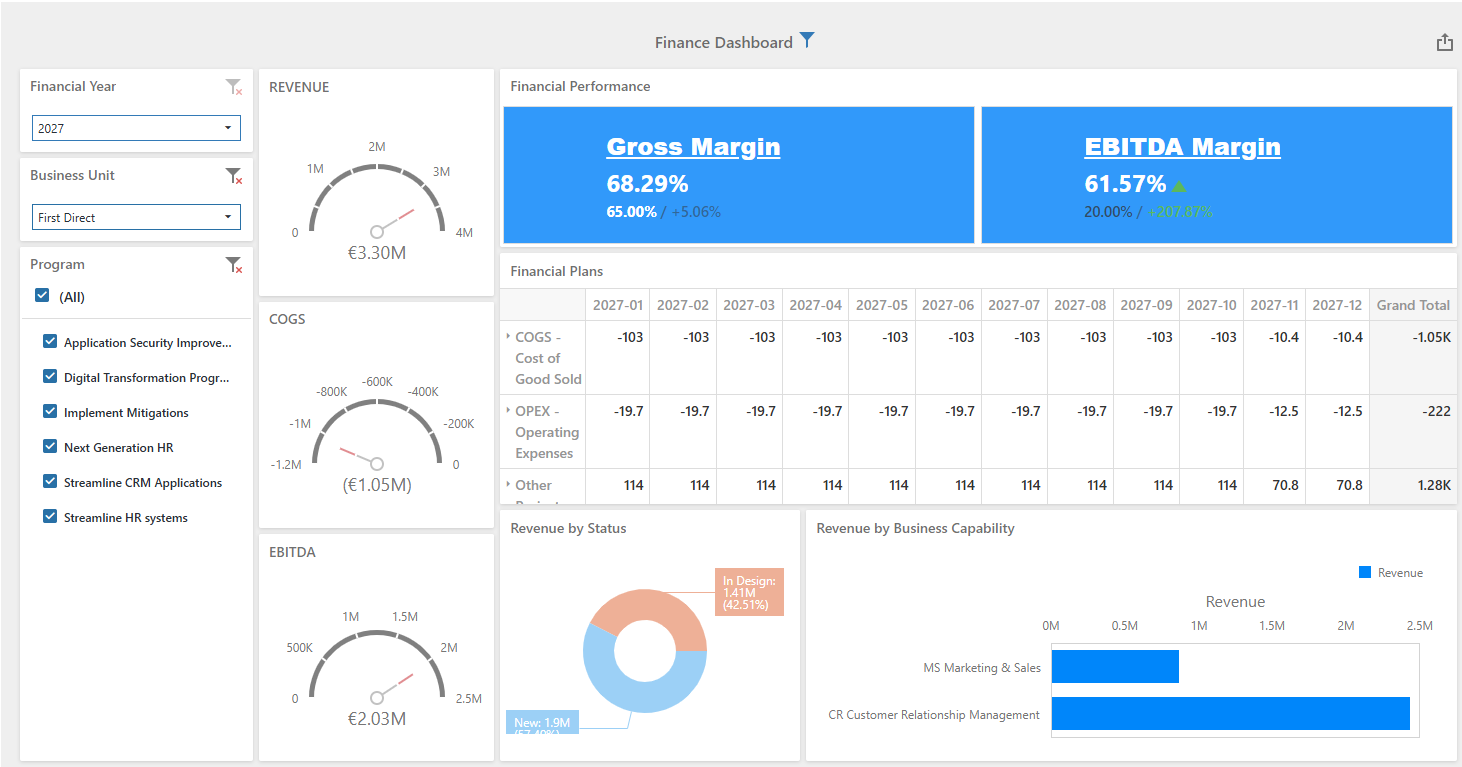
The dashboard calculates and presents key financial indicators:
- Revenue represents all project benefits for the current year, combining actual values for past periods and forecast values for future periods.
- COGS (Cost of Goods Sold ) includes all costs assigned to sub-cost types categorized as COGS - Cost of Goods Sold, using actual values for past periods and forecast values for future periods.
- EBITDA is calculated as total benefits minus total costs, combining actual and forecast values according to the period.
- Gross Margin represents the ratio between total benefits and the related COGS costs, providing insight into the profitability of delivered benefits.
- EBITDA Margin is calculated by dividing EBITDA by total benefits, indicating the percentage of revenue that remains after operational costs have been considered.
By consolidating project-level financial information into portfolio-level metrics, the Finance Dashboard helps stakeholders monitor financial performance and gain a comprehensive understanding of revenue generation, cost structures, and profitability trends across the organization.
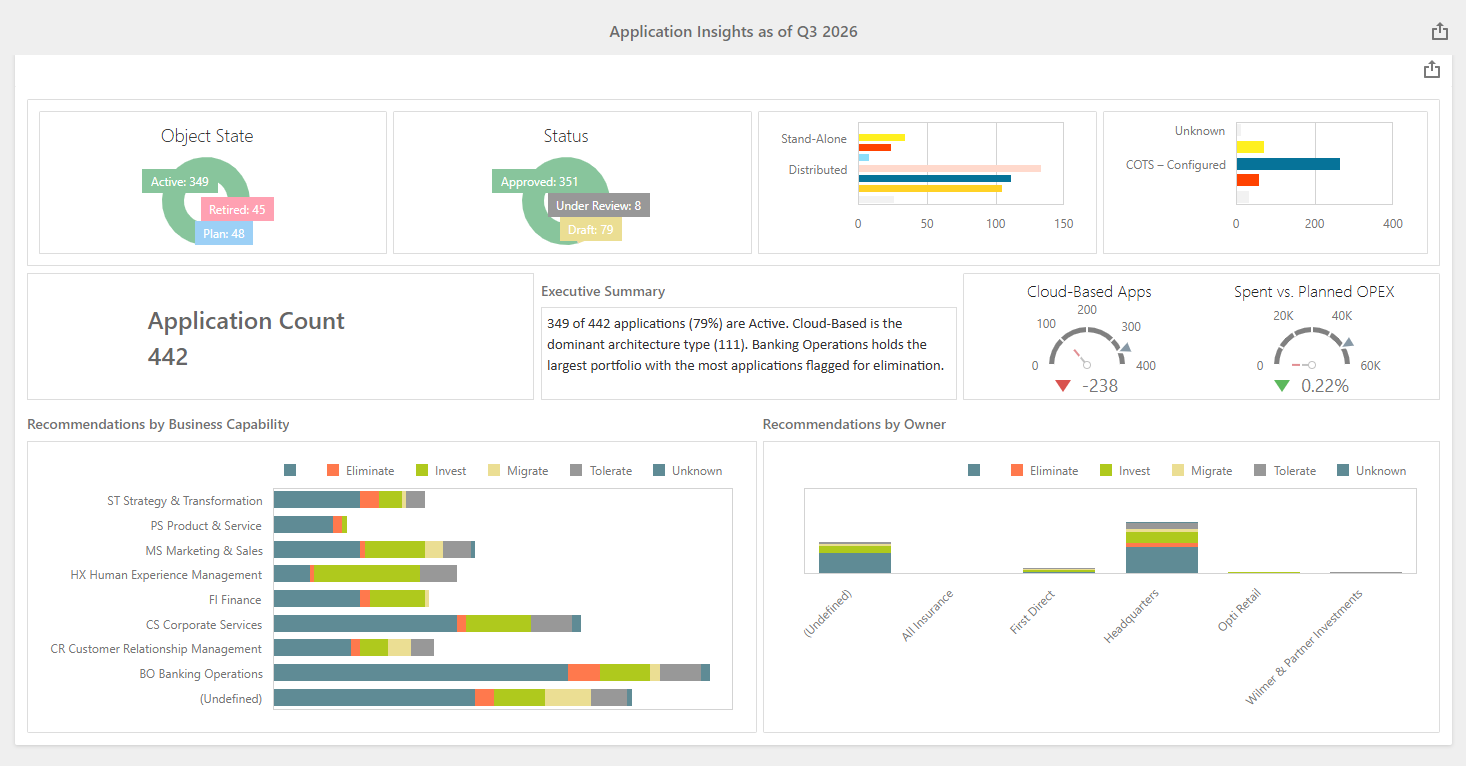
Enhanced visualization in Application Portfolio Analysis dashboard. The analytical dashboard Application Portfolio Analysis has been redesigned and visually optimized. The refreshed look and feel improves usability and makes key portfolio insights easier to access, understand, and act upon. The dashboard provides a comprehensive overview of the application portfolio, including application inventory metrics, current lifecycle and status information, operational expenditure (OPEX), and the distribution of investment recommendations. With its improved visualizations and streamlined presentation of data, users can more effectively assess portfolio health, identify optimization opportunities, evaluate investment priorities, and support data-driven decision-making across the application landscape.