
- Richer analysis with What are our cost drivers?
- Enhanced Sankey visualization for project buckets
- Streamlined project finances
- Improved demand management for strategic planning
- Lifecycle editing in Gantt charts
- Richer lifecycle data for contract deliverables
- Enhanced business object analysis and visualization
- Aligned business owner role
- On-demand rule execution for immediate data refresh
- Alignment of IT-Pedia attributes and streamlined visualization
The following enhancements to the Alfabet solution configuration are available with this release.
Richer analysis with What are our cost drivers?
The business question What are our cost drivers? has been enhanced to provide greater visibility into the applications and projects that support business capabilities as well as the primary cost drivers across the organization. The treemap report has been revised so that costs are calculated only for applications and projects with defined budget values. In addition, the Aggregate Costs By filter has been simplified to a single-selection control, allowing users to view either the aggregation of OPEX costs, CAPEX costs, or both OPEX and CAPEX costs.
To further support analysis and maintenance, new data workbenches have been introduced for applications and projects. Selecting Edit Applications opens a workbench that displays the budgeted applications, the business capabilities they support, and their current-year OPEX costs. The data can be sorted to identify the most expensive applications and understand which business capabilities they enable. Similarly, the Edit Projects option opens a workbench showing the budgeted projects, the business capabilities they impact, and their current-year project budgets. This provides a comprehensive view of project investments and their alignment with business capabilities.
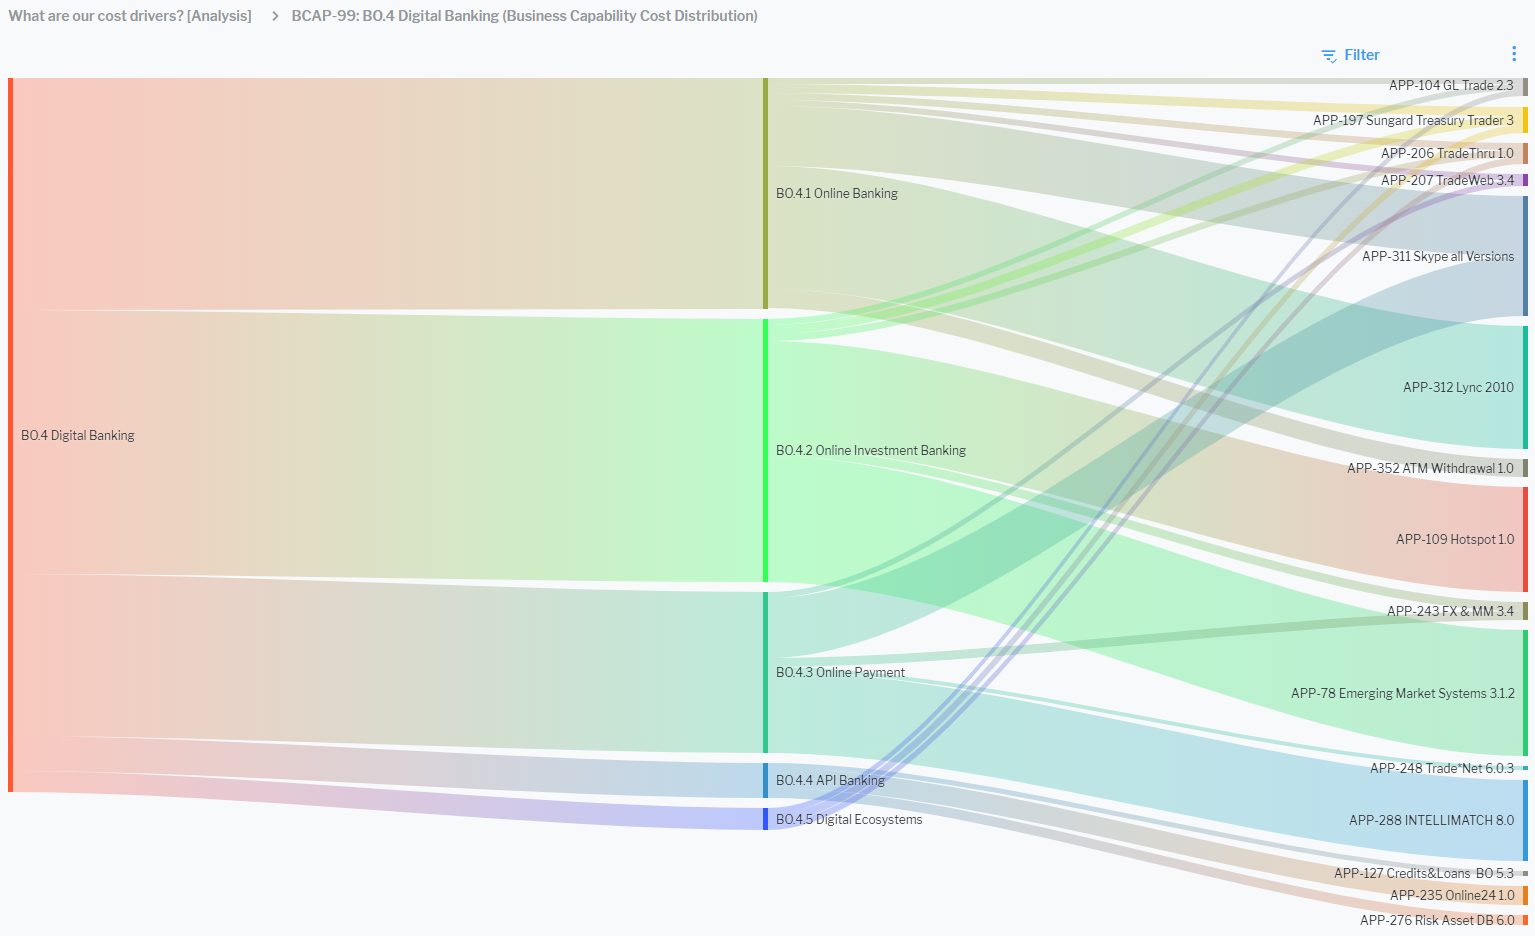
Additionally, a detailed Business Capability Cost Distribution visualization is available that shows the cost allocation for each business capability. Users can select any business capability and navigate to the new Sankey diagram that displays the business capability hierarchy and the distribution of costs from supporting applications and projects. The capability hierarchy is shown from the left to the center of the diagram, while the applications and projects contributing costs are displayed on the right. This allows users to better understand how costs are distributed across capability sub-levels that are not directly represented in the report.
Enhanced Sankey visualization for project buckets
The Sankey diagram Current Year Allocated Costs in the content area of a project bucket and provides a visual representation of how the project bucket’s budget is allocated across projects. A new filter allows users to switch between Requested Costs and Budgeted Costs, with Budgeted Costs selected by default.
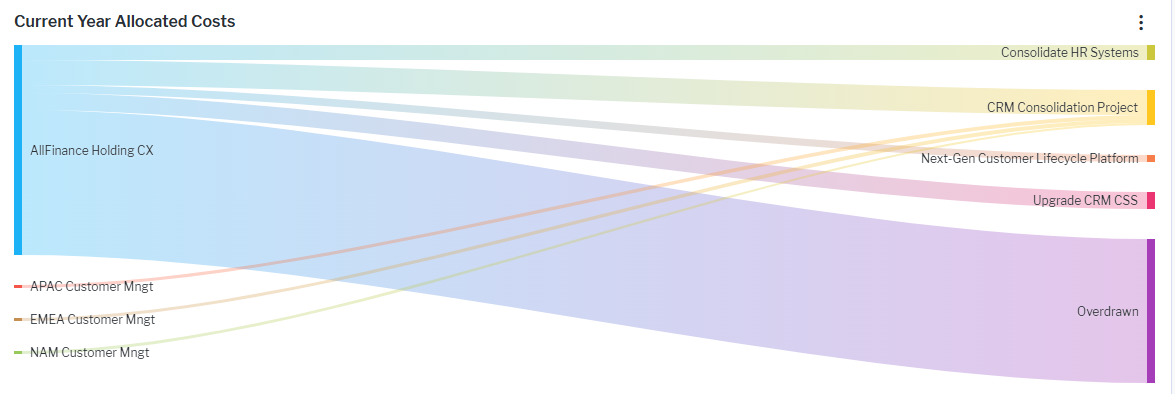
The visualization illustrates how the allocated budget of a project bucket flows to individual projects. The width of each flow is proportional to the allocated amount, enabling users to quickly identify major cost drivers and high-impact investments. When a project receives funding from multiple project buckets, the diagram also displays the contribution from each additional bucket, providing a complete view of the funding sources. Hovering over a flow displays a tooltip showing the project bucket name, the project consuming the budget, and the corresponding allocated cost. Any overdrawn budget is assigned back to the originating project bucket. Projects that exceed their allocated budget are highlighted in grey, and the tooltip clearly indicates that the project is overdrawn.
This Sankey diagram improves financial transparency by presenting complex allocation data in a clear and intuitive visual format. Users can quickly understand how budgets are distributed across the portfolio, identify which project buckets fund specific initiatives, and assess the relative size and importance of individual allocations. This makes it easier to analyze recognize projects with the greatest financial impact.
The license package Strategic Portfolio Management is required to work with project buckets. The use case Investment Optimization must be activated.
Streamlined project finances
The Benefit Tracking and Cashout-Out Planning views have been moved from the Financials page in the project content area to the Execution page. The Cashout-Out Planning view has been renamed Budget Realization.
These changes emphasize project execution and spending oversight rather than the initial funding and budgeting process. Positioning these views on the Execution page better aligns them with the operational workflow that follows funding approval, when project managers are primarily focused on delivery and are responsible for regularly reporting actual expenditures and forecasts. This change creates a more logical user experience while supporting more effective monitoring of project performance, spending, and forecast accuracy during the project lifecycle.
The license package Strategic Portfolio Management is required to work with these views. The use case Investment Optimization must be activated.
Improved demand management for strategic planning
Demand management has been enhanced to improve visibility, prioritization, and strategic alignment across projects and initiatives.
Centralized demand tracking for projects. A new Assigned Demands view is now available in the Overview page within a project's content area. This view provides a centralized location for managing and understanding the demands that inform the project. Users can add demands in the repository to the project and track and update demand status, set demand priorities, document the expected benefits of each demand, and record the organization that originated the demand. By helping stakeholders understand the drivers behind project work, the Assigned Demands view enables teams to identify which demands are most important, align priorities more effectively, and ensure that project activities are focused on delivering the highest-value outcomes.
Easier assignment of demands to strategic themes. Assigning demands to strategic themes is now easier and more intuitive. The Affected Architecture report in the content area of a strategic theme has been enhanced with a new Demands column, allowing users to directly associate demands with the selected strategic theme. This enhancement helps organizations better understand the business needs driving IT transformation initiatives, define strategic areas of focus that support their long-term vision, and improve the prioritization of projects, investments, and resources.
The license package Strategic Portfolio Management is required to work with these features. The use case Demand Management must be activated.
Lifecycle editing in Gantt charts
Lifecycle editing in Gantt reports has been refined to provide clearer ownership and prevent unintended conflicts. Lifecycle editing is available for objects at the base level of the report. Child objects displayed within the report can be viewed, but their lifecycles must be edited in their own dedicated lifecycle views. For example, in the Component Lifecycles view in an application's content area, only the lifecycle of the application itself can be edited directly in the Gantt chart. To modify the lifecycle of a component, users must navigate to the component's content area and edit it there. This ensures that lifecycle ownership remains clearly defined and prevents data inconsistencies, as a component may be shared across multiple applications.
An exception applies to grouped objects such as application groups and their applications or component groups and their components. In these cases, lifecycle updates can be made to both the parent group and its associated child objects within the same lifecycle view. For example, in the Assigned Applications - Lifecycles view of an application group, users can modify the lifecycle of the application group itself as well as the lifecycles of its assigned applications. Because this view is specifically intended for lifecycle management, editing is supported for both parent and child objects so that lifecycle information can be easily maintained.
Richer lifecycle data for contract deliverables
The Contracts - Lifecycles view has been enhanced to improve usability, make it easier to interpret lifecycle information, and provide greater insight into contract deliverable usage.
- A legend has been added to the view, displaying the icons for all relevant classes and the color coding used for component lifecycle phases in the Gantt chart.
- Users can now drill down into contract deliverable usage details directly from the view. The new content area provides detailed information about contract deliverable consumption, including the deliverable name, delivered volume, and the start and end dates of its usage.
Enhanced business object analysis and visualization
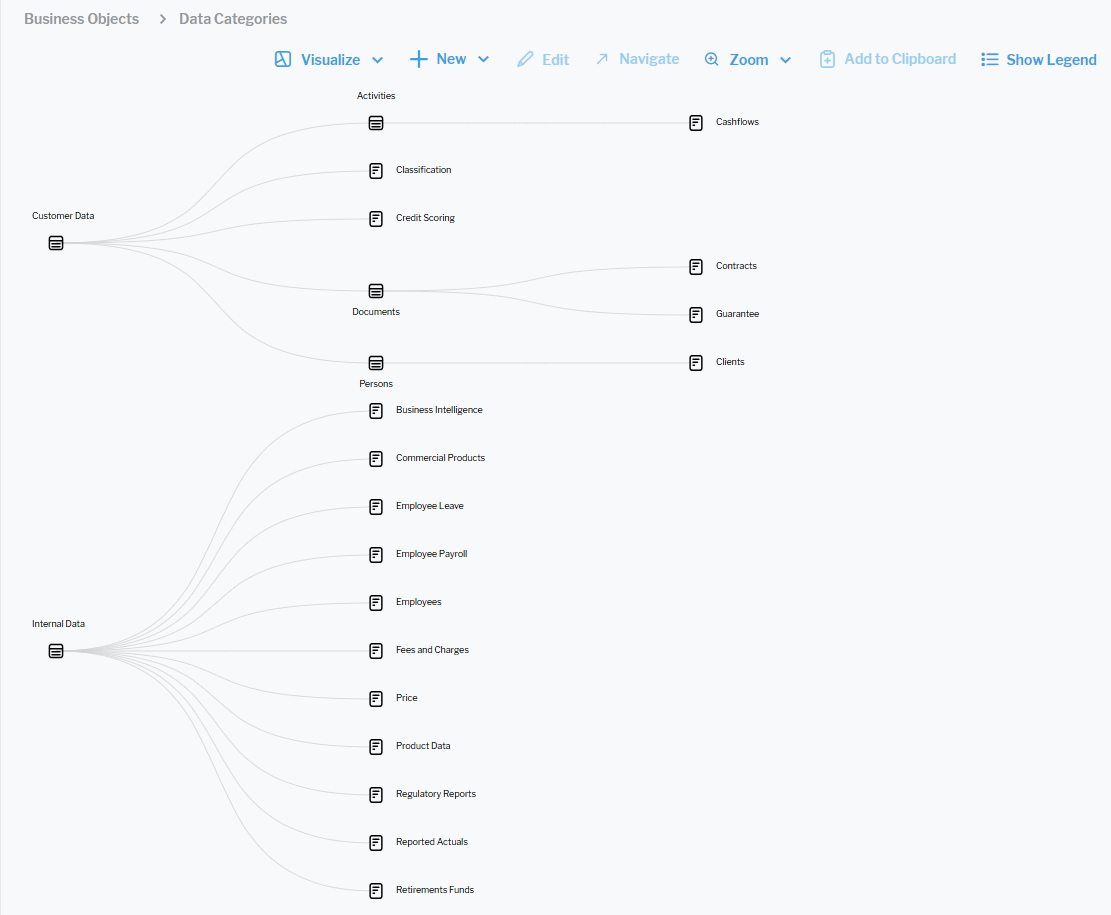
New network diagram reports are now available via the Visualize menu in the Business Object Categories and Business Objects. The Data Categories report in the Business Object Categories data workbench visualizes the hierarchy of the selected business object categories, including the business objects assigned to each category. This provides a clear view of category relationships and the business objects associated with them. The Data Categories report in the Business Objects data workbench visualizes the business objects selected in the data workbench together with the hierarchy of their parent business object categories. This enables users to understand how business objects are organized within the broader category structure and to explore their relationships more effectively.
The Business Objects view in the content area of a business object category has been updated to a data workbench that allows you to slice-and-dice the data via filter settings so that you only see what is relevant for you. The data workbench includes the standard ad-hoc analytics and visualization capabilities so that users can quickly gain insights about the selected business objects.
Aligned business owner role
The Business Owner role has been standardized across all classes to provide a more intuitive and consistent definition. When the Business Owner role is assigned to a person, only one person can be designated as the business owner. When the Business Owner role is assigned to an organization, only one organization can be designated as the business owner. Note that an asset can have both a person and an organization assigned as business owners simultaneously, allowing for one person business owner and one organization business owner per asset. This alignment ensures consistent ownership modeling while supporting both individual and organizational accountability.
On-demand rule execution for immediate data refresh
New capabilities have been introduced to ensure that users always see the most accurate and up-to-date information in the user interface. Administrative users can now trigger the execution of computation and data quality rules directly from the application:
- Rescan Computation Rules: A new button is available in the content areas for evaluation types and indicator types. Triggering this action executes the underlying computation rules and immediately updates all affected evaluations, ensuring that the latest results are reflected in the user interface.
- Rescan Data Quality Rules: A new button has been added to the Data Quality Rules view. This allows administrators to re-execute modified data quality rules on demand, ensuring that users can immediately access the most current data quality analysis without waiting for the next scheduled execution.
Alignment of IT-Pedia™ attributes and streamlined visualization
The IT-Pedia page in the content area for components has been streamlined and aligned with the underlying meta-model. Previously, some IT-Pedia properties were displayed in the content area, while many other IT-Pedia properties existed in the meta-model but were not reflected in the user interface. The IT-Pedia page has been revised to display only the attributes required for the current use case implemented in the solution configuration. The attributes shown are those relevant to IT-Pedia Model Catalog - Models and My Products - Models.
Non-essential IT-Pedia properties that did not provide valuable API data have been removed from the class model. Existing customer databases remain unaffected, while new installations and deployments based on the 11.12.1 Solution DB will include only a streamlined set of IT-Pedia properties. They remain available in the XML object ITPediaConfig and have been commented out for future use or reactivation if needed. In addition, the ADIF scheme ITPedia_MyProductCatalog has been updated to ensure consistency with the updated configuration.