New
The following is introduced to the Alfabet solution configuration this release.
Users can keep track of assets using the Watch button, available in the three-dots menu within an asset’s content area. All watched assets are collected on the new My Watch List page, accessible via the Recent Assets section in the navigation panel. This page provides a report showing all watched objects as well as when the asset was last updated and who updated it.
Users will also receive notifications when the watched assets are updated, including changes to attributes and relationships. To reduce notification volume, updates are bundled into a single daily summary email, listing all changed objects (e.g., up to 10 objects per notification).
The new reports Business Capabilities Impacted by Projects, Business Capabilities Impacted by Demands, and Business Capabilities Impacted by Epics are now available in the Visualize menu within the data workbenches for demands, projects, and epics, respectively.
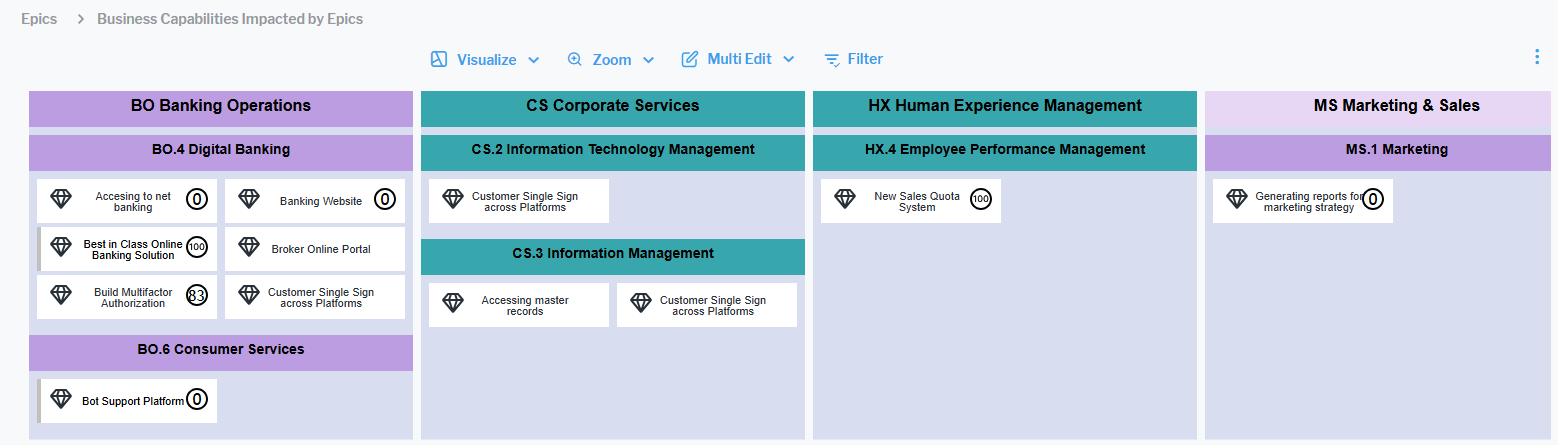
These nested matrix reports highlight the business capabilities affected by each initiative, helping to uncover overlaps, redundancies, and potential inefficiencies. The relevant projects, demands, or epics can be filtered in the data workbench so that users can focus on the impact of specific initiatives on business capabilities. Users can highlight mission-critical business capabilities to assess whether they are receiving sufficient investment, and enhance their analysis with a range of relevant KPIs.
These reports enhance visibility into where investments intersect, enabling more effective resource allocation and stronger alignment with strategic capabilities. They also help organizations clearly identify which initiatives have the greatest impact on critical business capabilities, making it easier to prioritize investments that deliver the highest long-term value while staying aligned with overarching strategic goals.
The Business Capabilities Impacted by Demands report requires the license Strategic Portfolio Management and the Business Capabilities Impacted by Epics report requires the license Lean Portfolio Management.
New Sankey visualization of project bucket spend limits. The new Project Buckets - Aggregated Spend Limits view is available on the root node of the project buckets explorer.
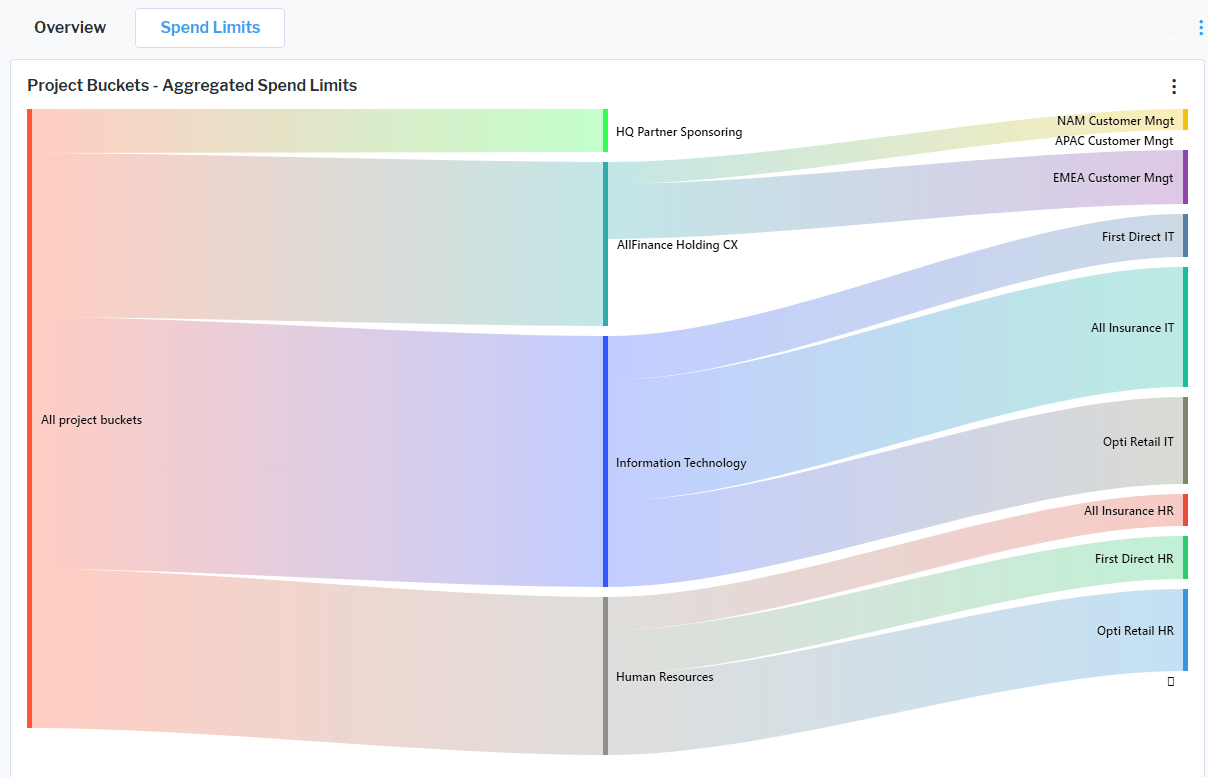
The Sankey diagram visualizes the flow between project buckets and their spend limits. The width of each connection represents the magnitude of the allocation. The visualization provides an easy overview of cost distribution across project buckets, highlights key contributors to overall project costs, reveals funding concentrations or gaps at a glance, and enables better understanding of budget allocation decisions without the need to analyze raw data tables. By presenting complex financial relationships in a visual flow format, the Sankey diagram makes it much easier to quickly understand how budgets are distributed, identify major cost drivers, and spot imbalances or concentration of spending.
New Sankey visualization of the flow of project buckets and project costs. A new Sankey diagram Current Year Allocated Costs is available in the content area of a project bucket to provide enhanced visibility into how budgets are distributed across projects.
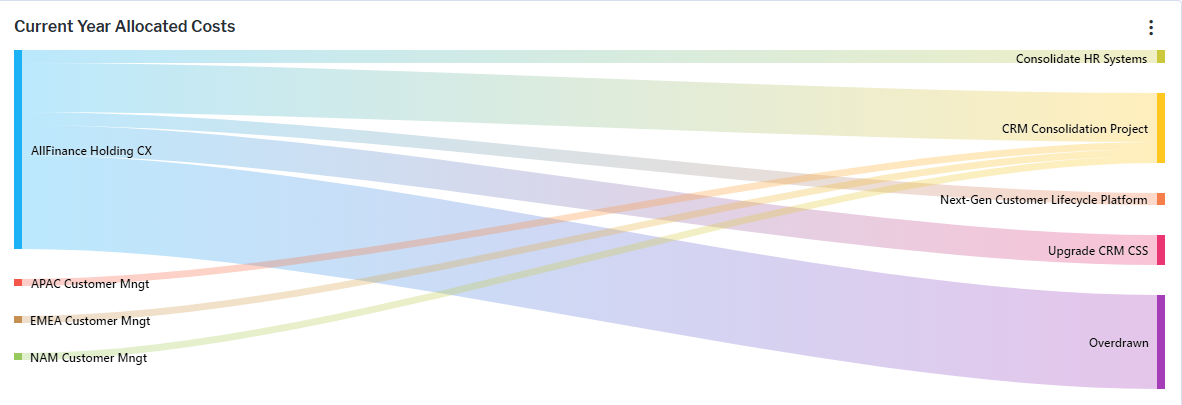
The visualization shows the flow of allocated costs from project buckets to individual projects, making it easy to understand funding relationships and dependencies. The width of each flow represents the magnitude of the allocation, enabling users to quickly identify major contributors and high-impact investments. If projects are allocated to multiple project buckets, the other project buckets are shown with their contribution.
The Sankey diagram enhances financial transparency and supports more informed decision-making by presenting complex allocation data in a highly visual and accessible format. Users can understand how budgets are allocated across the portfolio. identify which project buckets fund specific initiatives, and understand the relative size and importance of each allocation.
The license package Strategic Portfolio Management is required to work with project buckets. The use case Investment Optimization must be activated.
Improved visualization of project indicators. The visualization of project indicators has been enhanced in the Prioritization view of a project bucket. The key indicators Project Risk, Architectural Impact, and Business Value are now displayed more clearly, enabling users to quickly assess and compare project characteristics and make more informed prioritization decisions.
A new SLA page is automatically added to the content area of a business and support services as soon as the service level agreement (SLA) is created. The content page centralizes all SLA-related information, providing a comprehensive view of the agreed service standards between providers and consumers. The SLA page includes key details such as the related service, defined service uptime and validity periods, planned maintenance windows, and incident-related information and key performance indicators such as availability, backup frequency, responsiveness, and security breach alert timelines. This enhancement improves transparency and ensures that all relevant service performance expectations and commitments are easily accessible in one place.
The license package Enterprise Architecture Management is required to work with business services, support services, and their service level agreements. The use case Service Portfolio Management must be activated.
The integration reports for Horizzon and Unify have been updated. Class selection is now controlled by each class’s default settings, simplifying configuration and ensuring consistency. Additionally, the meta model and API reports have been enhanced to include shadow and calculated properties. As a result, customers can now access, via the REST API, all the information available on the class itself.