Design diagrams visualizing your IT landscape
In Alfabet , you can model aspects of your IT landscape in diagrams. Alfabet provides the Alfabet Diagram Designer, a diagramming tool that enables you to design and model an IT landscape for assets that support diagram design.
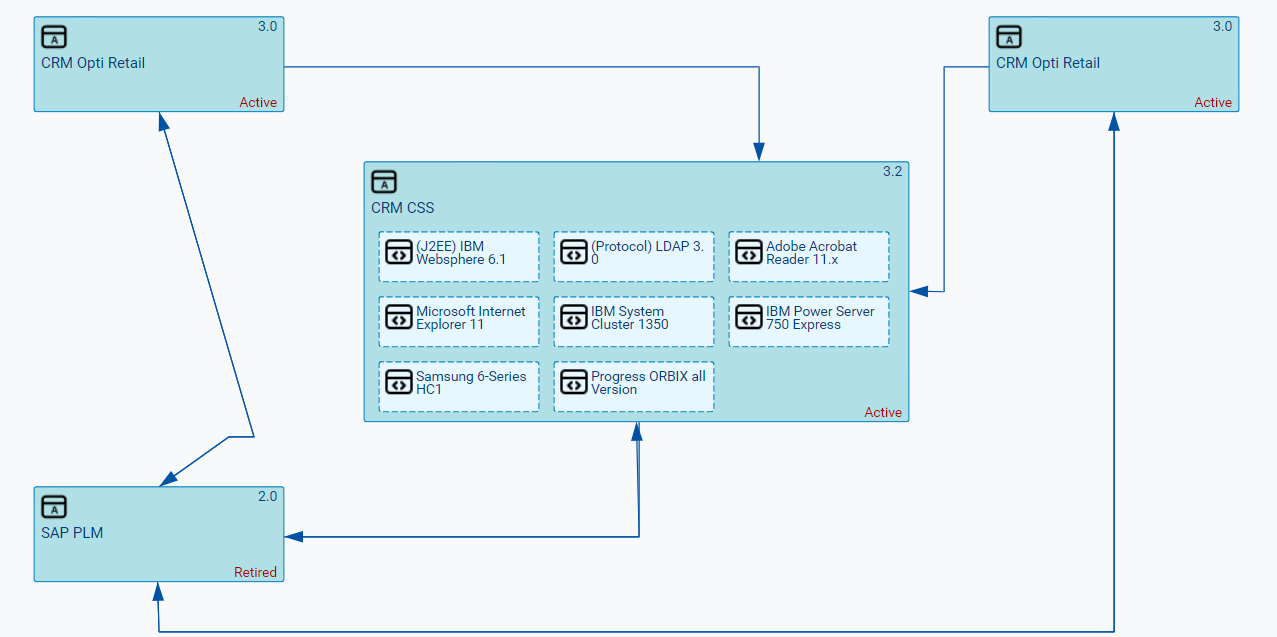
Diagrams can be designed that depict a particular segment of your IT landscape. For example, you can visualize an application group including its applications, information flows, and the components that the applications use, the application landscape that supports a business process, or the applications impacted by a project.
When designing a diagram, you can:
- Add assets that exist in the repository to the diagram. For example, you can add applications and application groups that exist in the repository to the diagram.
- Create placeholder objects that you can then later replace with an asset in the repository. For example, if you don't yet know which application, application group, or information flow you want to have in your application landscape, you can add a placeholder with simple text. Later you can replace the placeholder with a relevant application, etc. that is in the repository.
- Easily add assets to the diagram that are referenced by objects in the diagram. For example, you could automatically add referenced local components to an application and referenced applications to an application group. It is recommended that you first add all relevant assets from the repository to the diagram if you want to automatically add referenced local components to application and referenced applications to an application group.
- Edit the basic attributes for a selected asset in the diagram. For example, change the application's start/end dates.
- Remove a diagram item from the diagram. For example, you can remove an an application or information flow from the diagram so that it is not visualized. This lets you create a diagram with only the relevant information you wish to convey. You can delete any information flow from the repository that was created in the context of the diagram.
- Add shapes and other design elements. You can add a legend, text, arrows, color, etc. in order to provide additional information in the diagram.
Some diagrams such as the Information Flows Diagram views are automatically generated and display an up-to-date diagram created at runtime. Dynamically-generated diagrams cannot be manually designed or edited.
All changes made in the context of the diagramming tool are saved to the repository. If you attempt to save a diagram that has concurrently been changed by another user, the changes that the other user has made to the diagram may be overwritten when you save the diagram.
- Go to Diagrams > Application Landscape Diagram. You will either see a default diagram or a diagram that has been designed by a user with access permissions to the application.
- To edit the design of the diagram, click the 3-dots
 menu > Action > Open Diagram. The Diagram Designer opens in a new browser tab.
You can leave the diagramming tool at any time and later come back continue designing the diagram. The saved diagram will be visible in the Application Landscape Diagram view.
A status message is displayed on the left side of the toolbar with the status Not yet saved if changes to the diagram have not been saved.
- To save the diagram click the Save button in the bottom right of the diagram to save your changes. The status information is updated to Saving and then Saved.
- To close the diagram and save your changes, click the X button in the top right corner.
- To close without saving your changes, click the Cancel button in the bottom right of the diagram.