
- Better visualization of project stereotypes in Gantt reports
- Greater visibility and maintenance of project dependencies
- Clarified budget control reports for programs
- More flexibility for demand prioritization
- Easier maintenance of the strategy network
- Streamlined management of service delivery and consumption
- Asset-centric contract management
- Validation of business support definitions
- Enhanced readability of data quality completeness
- Improved filter guidance and accessibility
- Clearer insight into licensed user cases
- Improved performance for administrative reports
The following enhancements to the Alfabet solution configuration are available with this release.
Better visualization of project stereotypes in Gantt reports
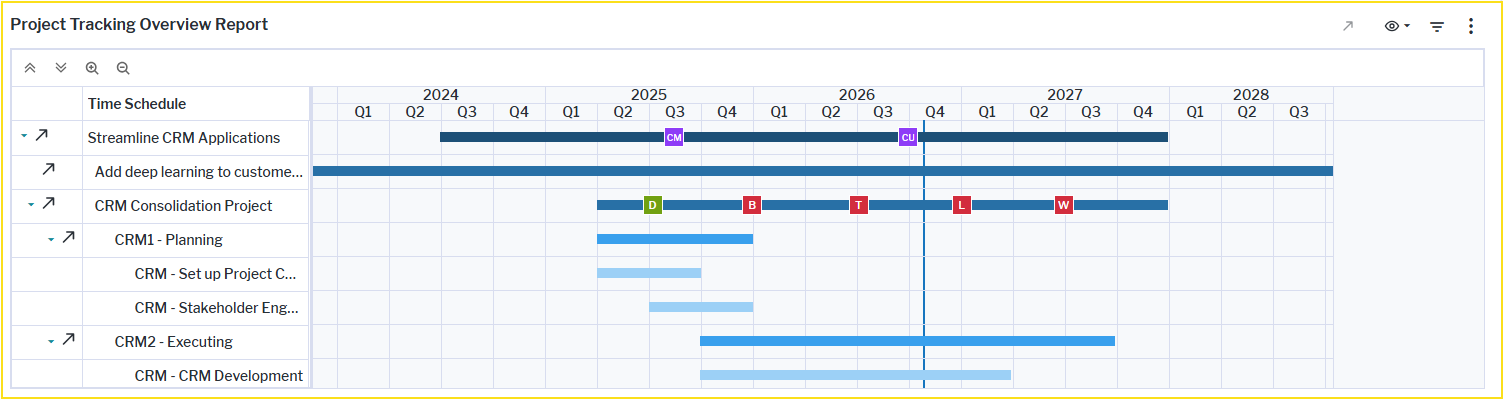
Project stereotypes are now displayed using distinct, consistent colors across Gantt-based reports. The stereotypes Program, Project, Work Schedule, and Task each have a distinct color making it easier to distinguish between different project elements at a glance.
This enhancement improves readability and navigation in reports such as the Work Breakdown Structure, Project Tracking Overview, Monitoring reports and the business question What is the status of our project portfolio?
The colors are also applied to current project in the Project Baselines - Lifecycle view, whereby the base line projects show a grey bar.
Greater visibility and maintenance of project dependencies
Better project dependency specification and management. Project dependency management has been expanded in project content area > Monitoring > Project Dependency Map. The matrix-based view now includes a runtime editor and object inspection capabilities, allowing users to review and maintain project dependencies directly in the visualization. Dependency-specific comments are available in the object inspection pane, providing additional context for analysis and decision-making. For dependencies of the type Architecture, affected architecture elements can be defined either directly in the object inspection pane or through the Edit action, streamlining the maintenance of architectural impacts. Users can select any affected architecture element that has been specified for both projects.
The Project Dependency view previously available on the Overview page has been moved to the content repository. Its primary functionality is now provided by the Project Dependency Map, which offers a more intuitive and efficient user experience for analyzing and maintaining project dependencies. The view remains available for managing projects that are dependent on, or affected by, the current project.
Improved analysis of project dependencies in business question Where are our project dependencies? The Where are our project dependencies? business question has been extended to provide greater context and faster access to project and dependency details. Programs and projects can now be distinguished more easily through dedicated class icons.
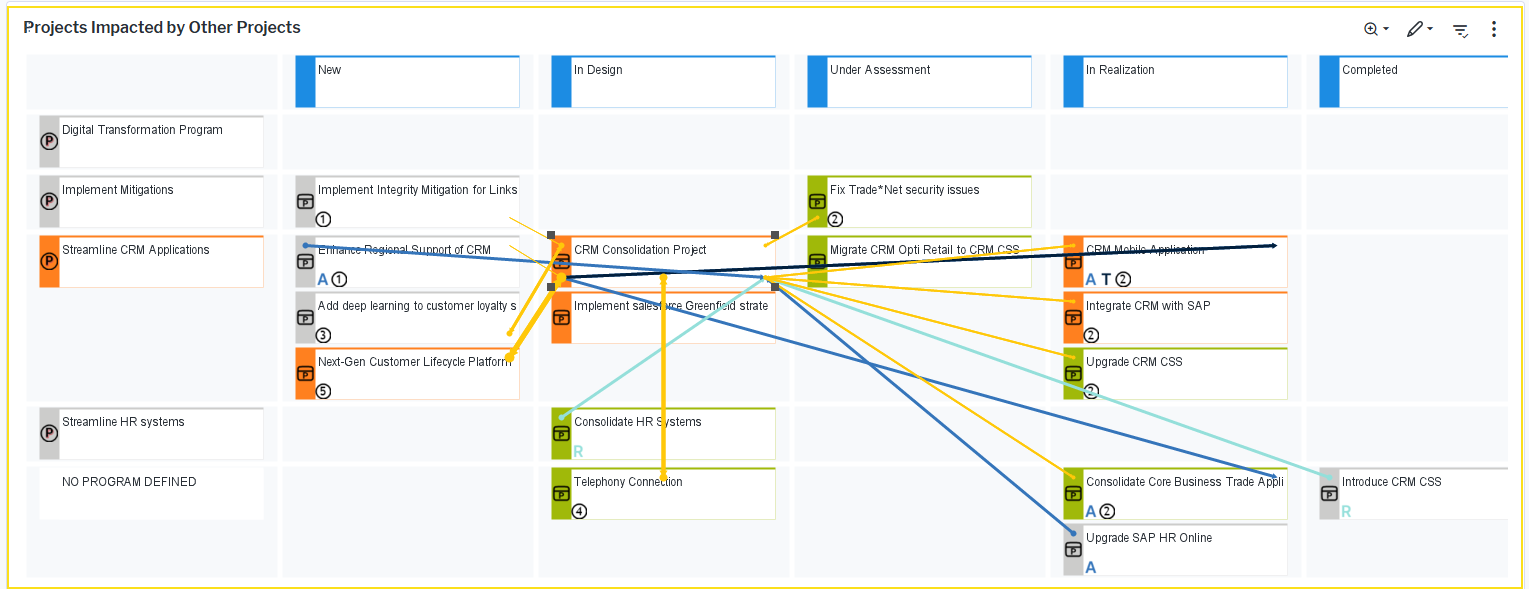
When the Dependency Type filter is set to Affected Architecture, users can double-click the dependency count displayed on a project to open a report showing the architecture elements affected by both projects. For dependencies of the types Resource, Time, and Architecture, users can click the corresponding dependency indicators ( R, T, and A ) directly within the visualization to open the object inspection and review detailed dependency information. Maintenance of architecture-related dependencies has also been streamlined. When creating or editing a project dependency of the type Architecture, affected architecture elements can be defined directly in the object inspection pane or through the Edit action, which opens a dedicated wizard.
The color coding of dependency connections has been aligned with the corresponding dependency type indicators ( R, T, and A) to make project dependencies easier to identify and distinguish within the visualization. In addition, the visualization of affected architecture dependencies as yellow connections has been refined to provide a more consistent representation of relationships between projects and the number of shared affected architecture elements. This makes architectural dependencies easier to interpret and compare across the project landscape.
Additional contextual information is now available through tooltips. Hovering over a project or program displays its description, while tooltips for project dependencies show the dependency type. For Architecture dependencies, the tooltip also identifies the affected architecture element.
Improved visibility of project dependencies in business question What is the status of our project portfolio? The What is the status of our project portfolio? business question has been extended with additional project dependency information to improve transparency and simplify dependency analysis. Tooltips are now available for project dependencies and display the dependency type at a glance. For dependencies of the type Architecture, the tooltip also identifies the affected architecture element, providing users with immediate access to relevant dependency details without requiring additional navigation.
The license package IT-Transformation Server - Enterprise is required to work with the business question Where are our project dependencies? The use case Project Portfolio Design must be activated.
Clarified budget control reports for programs
To improve clarity, two budget control reports for programs that previously shared the same caption have been renamed to better reflect their purpose.
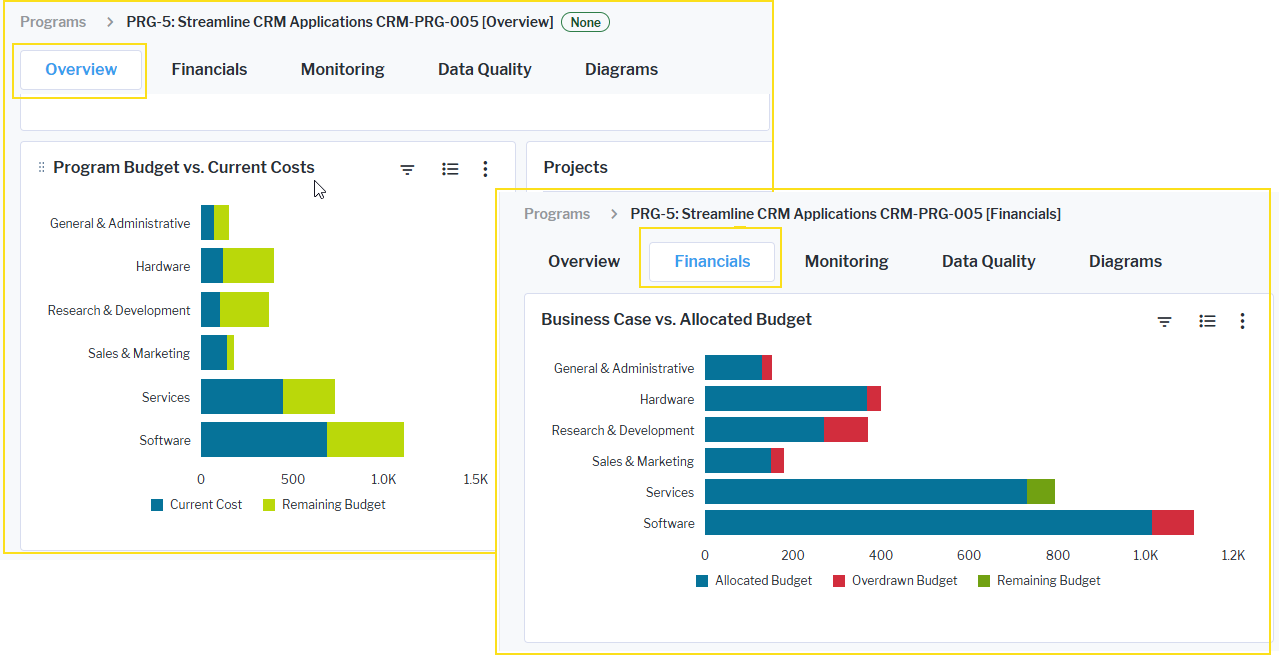
The report on the Overview page is now titled Program Budget vs. Current Costs and compares the aggregated current costs against the aggregated approved budget of all projects in the program. The report on the Financials page is now titled Business Case vs. Allocated Budget and compares the aggregated business case values of all projects within the program against their allocated budgets. These updated captions make it easier to distinguish between the two analyses and understand their respective focus areas.
The license package Strategic Portfolio Management is required to work with programs. The use case Project Portfolio Governance must be activated.
More flexibility for demand prioritization
The demand assessment capabilities in the business question Which demands shall be realized? have been significantly enhanced to provide greater transparency and control when evaluating and prioritizing demands. The Demands - Business Value chart has been replaced by two dedicated doughnut charts: Business Value Prioritization and Architectural Impact Prioritization. Users can now customize prioritization criteria through the new Edit Weightings functionality. For Business Value Prioritization, the weighting of Cost Savings Potential, Market Opportunity, and Strategic Value can be adjusted. For Architectural Impact Prioritization, users can modify the weighting of Complexity Reduction, Standardization, and Innovation. Weightings are configured through interactive sliders and the business question immediately reflects the prioritization results and visualizations.
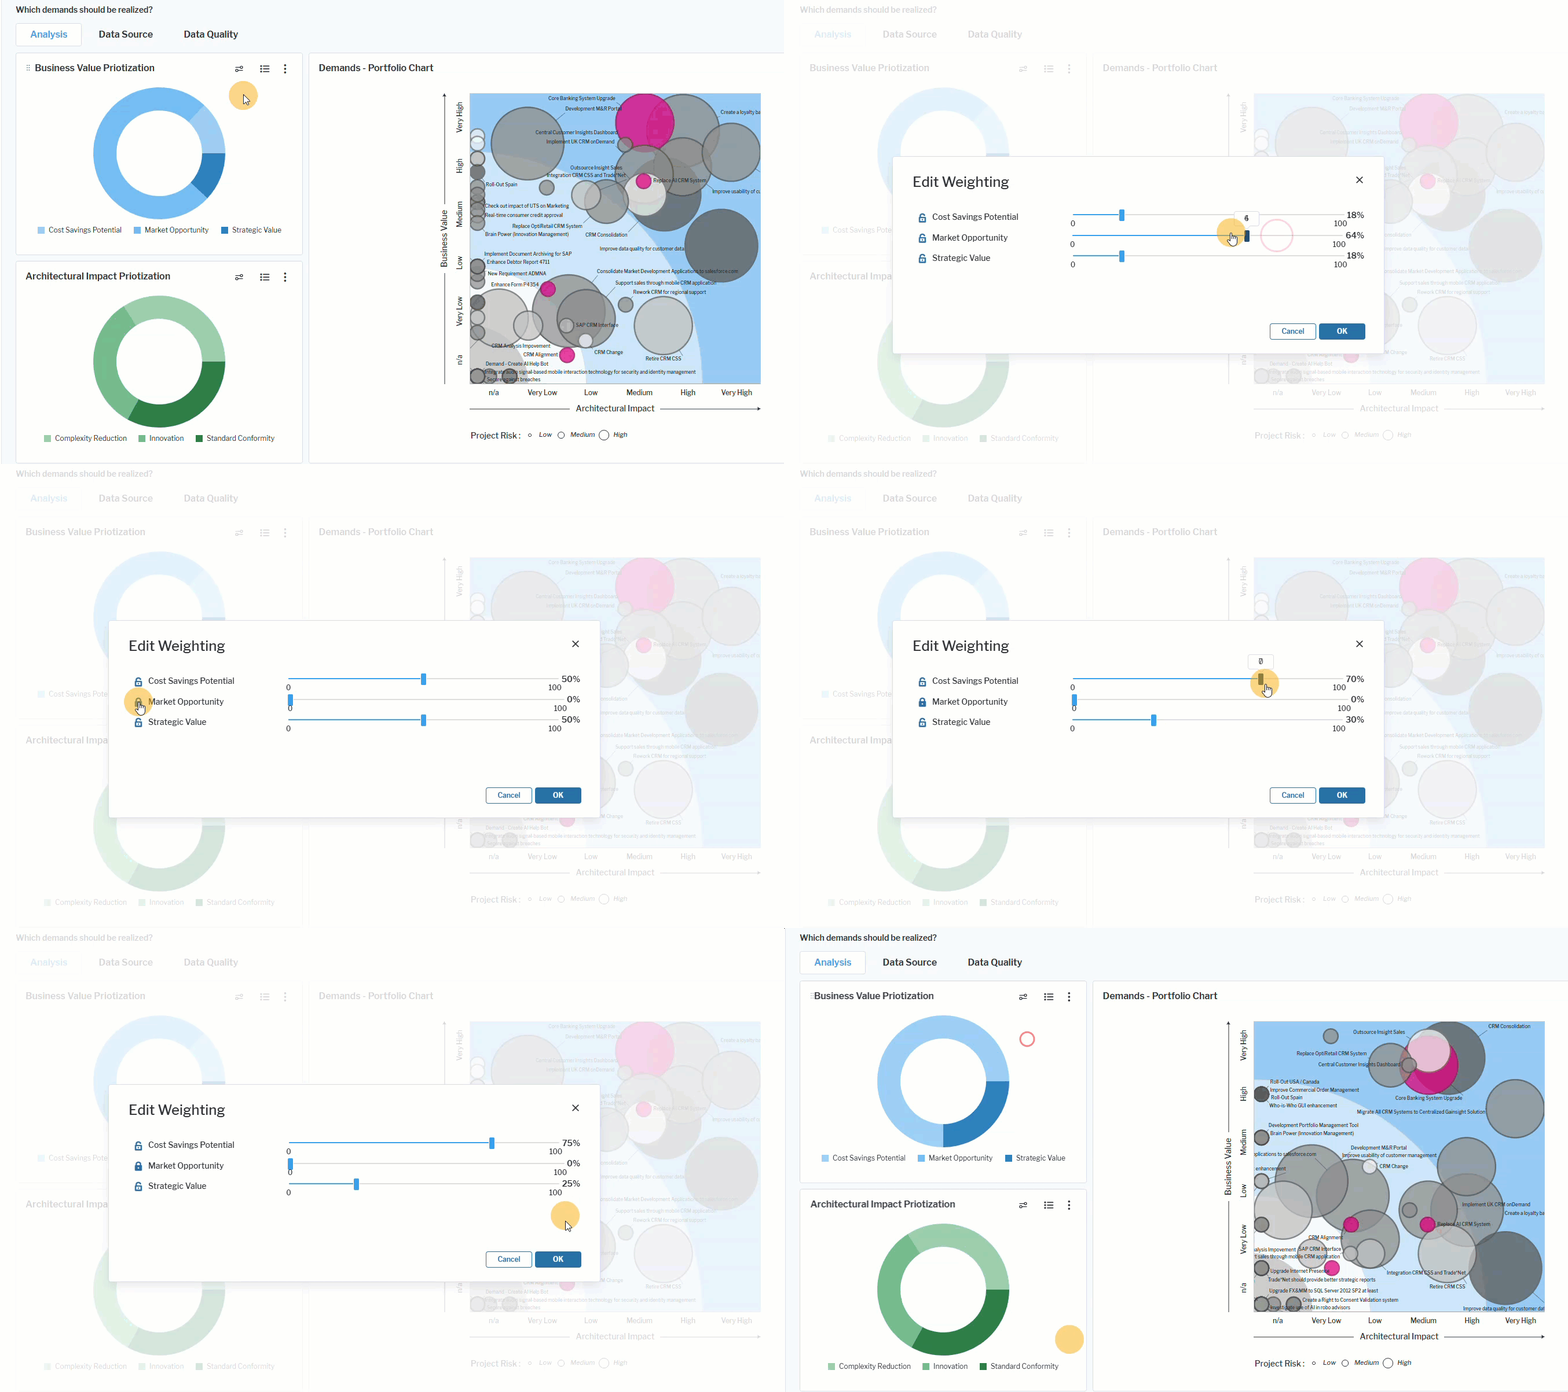 Click here to see how.
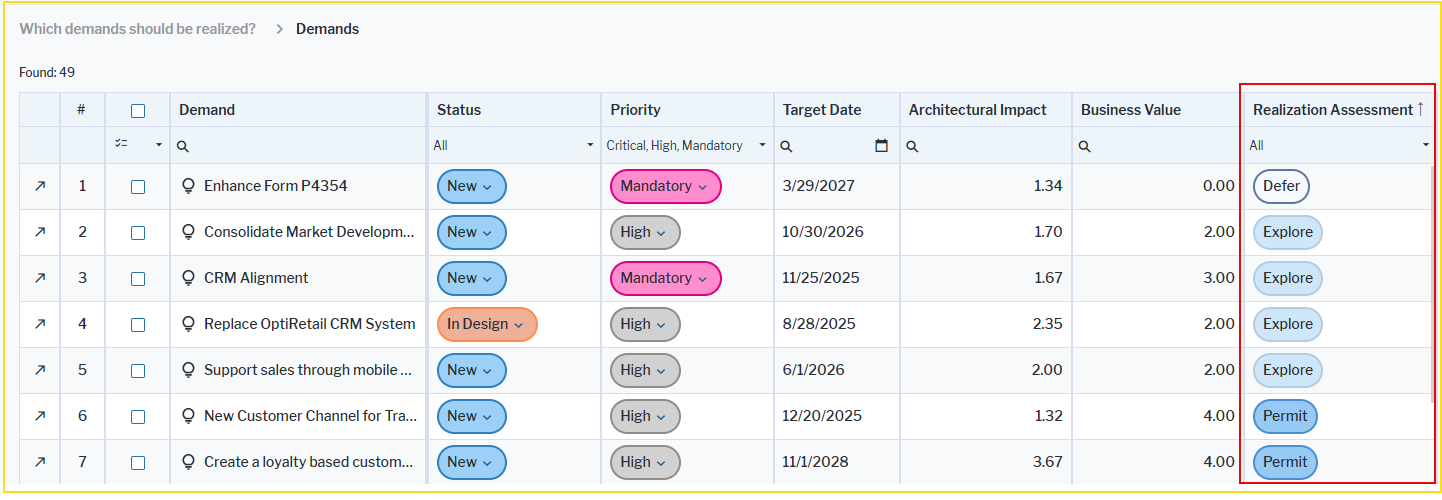
To further improve analysis capabilities, a new Demands data workbench has been added to the business question. The workbench displays all demands included in the portfolio and introduces dedicated columns for Business Value, Architectural Impact, and the new calculated property Realization Assessment.
Realization Assessment dynamically evaluates each demand based on its current Business Value and Architectural Impact scores, taking the configured prioritization weightings into account. Depending on the assessment outcome, demands are categorized as Permit, Explore, Defer, or Unassessed, enabling organizations to make more informed and transparent investment and realization decisions.
The license package Strategic Portfolio Management is required to work with demands. The use case Demand Management must be activated.
Easier maintenance of the strategy network
New data workbenches have been introduced to replace the graphical views previously used to capture and maintain strategy network nodes. The Goals data workbench in the vision content area, the Objectives data workbench in the goal content area, and the Strategic Themes data workbench in the objective content area provide comprehensive data maintenance capabilities in a tabular format.
Each workbench includes a Strategic Weighting column that displays the weighting distribution across all subordinate nodes, with the total allocation equalling 100%. An Update Weights action enables users to update and recalculate node weightings directly within the workbench, simplifying the maintenance of strategy networks and ensuring weighting consistency.
Streamlined management of service delivery and consumption
New data workbenches are now available in the new Service page in the organization content area that simplify the management of service delivery and consumption from an organizational perspective.
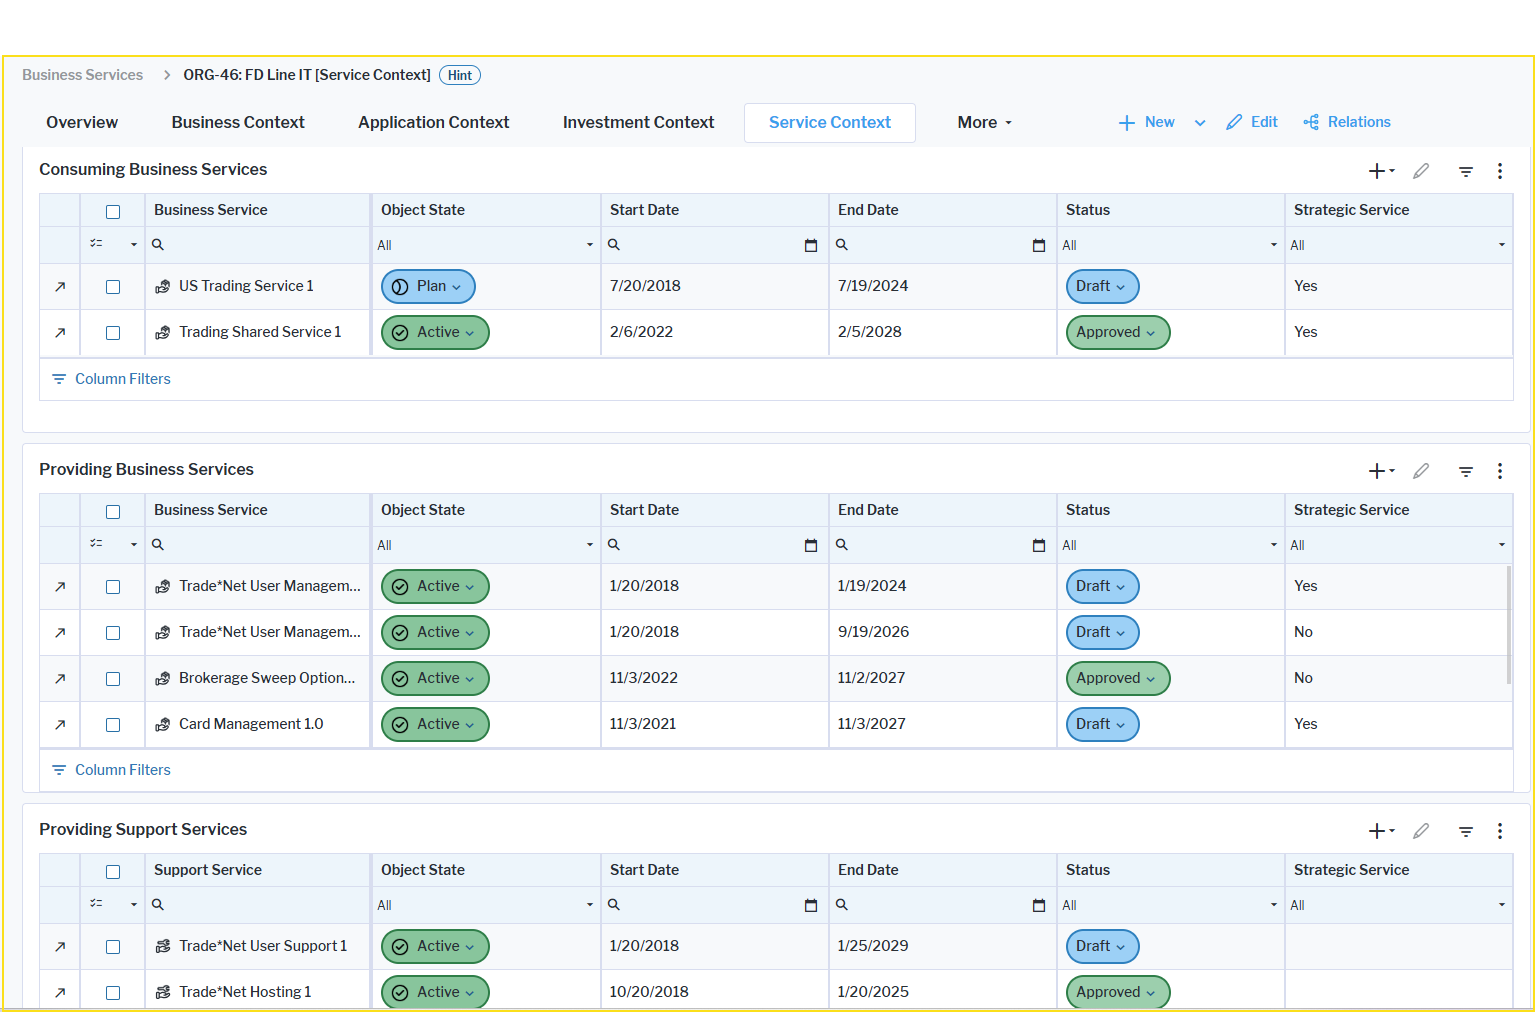
- Consuming Business Services > Assign Business Services Consumed by Organization
- Providing Business Services > Assign Business Services Provided by Organization
- Providing Support Services > Assign Support Services Provided by Organization
These data workbenches provide a dedicated and streamlined way to maintain service relationships, making it easier to manage which organizations consume services and which organizations provide business and support services. This improves transparency, reduces administrative effort, and helps keep service assignments accurate and up-to-date.
The license package Enterprise Architecture Management is required to work with these data workbenches. The use case Service Portfolio Management must be activated.
Asset-centric contract management
New Contract Deliverables data workbenches are available for all assets that can be specified as a deliverable for a contract or contract item. These data workbenches replace the previous graphic views and make it easier to capture, manage, and analyze the obligated deliverable that must be provided to fulfill the terms of a contract or contract item.
Available in the Business Context page in content areas for applications, components, business services, support services, physical devices, and virtual devices, these data workbenches enable users to quickly associate the current asset with one or more contracts and define related one-time costs, recurring monthly costs, and currency information. Contracts associated with assets defined as a deliverable are also displayed, providing complete visibility of existing relationships, although these associations cannot be created or modified in the Contract Deliverables data workbenches.
The Contracts - Lifecycles view complements the data workbench by displaying contracts together with their contract items that are linked to the asset through contract deliverables, providing a comprehensive overview of the asset's contractual context. By offering clear visibility into the contracts linked to each asset, these new data workbenches enable stakeholders to make more informed architectural and investment decisions while ensuring alignment with agreements established with IT suppliers and service providers.
The license package Contract Management is required to work with contract deliverables. The use case Contract Alignment must be activated.
Validation of business support definitions
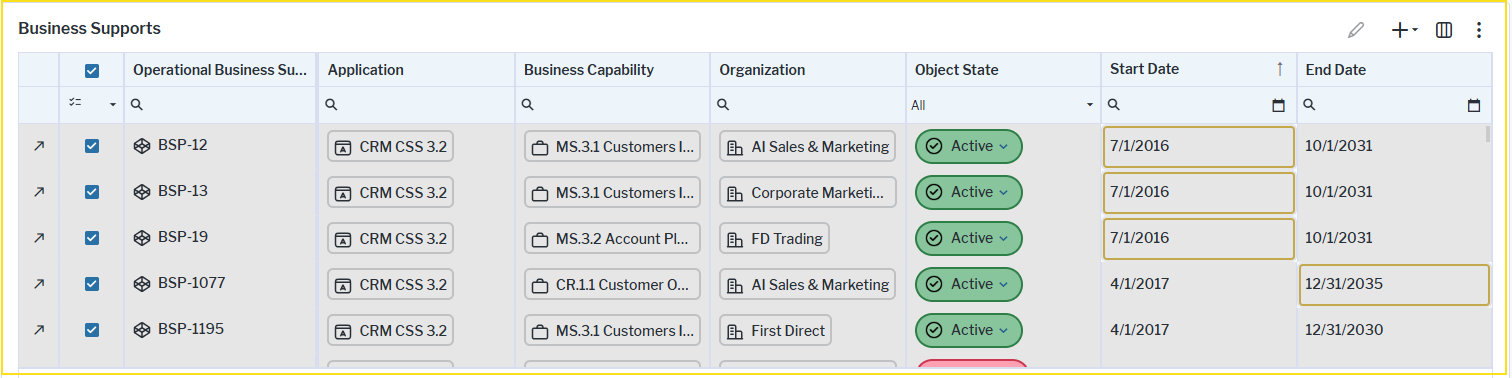
New data quality rules have been introduced to help ensure the accurate definition of business supports. These rules validate that business supports are aligned with the lifecycle of the application providing the support. When a violation is detected, it is displayed in the Business Supports data workbench available in the content areas for applications, organizations, and business capabilities. To review all violations, all objects must be selected in the data workbench. The following new data quality rules are available:
- DQR-262: Business support start date not aligned with application validates that the start date of a business support is the same as or later than the start date of the application providing it. Violations can be resolved by updating the business support start date to align with the providing application's lifecycle.
- DQR-263: Business support end date not aligned with application validates that the end date of a business support is the same as or earlier than the end date of the application providing it. Violations can be resolved by updating the business support end date to align with the providing application's lifecycle.
Enhanced readability of data quality completeness
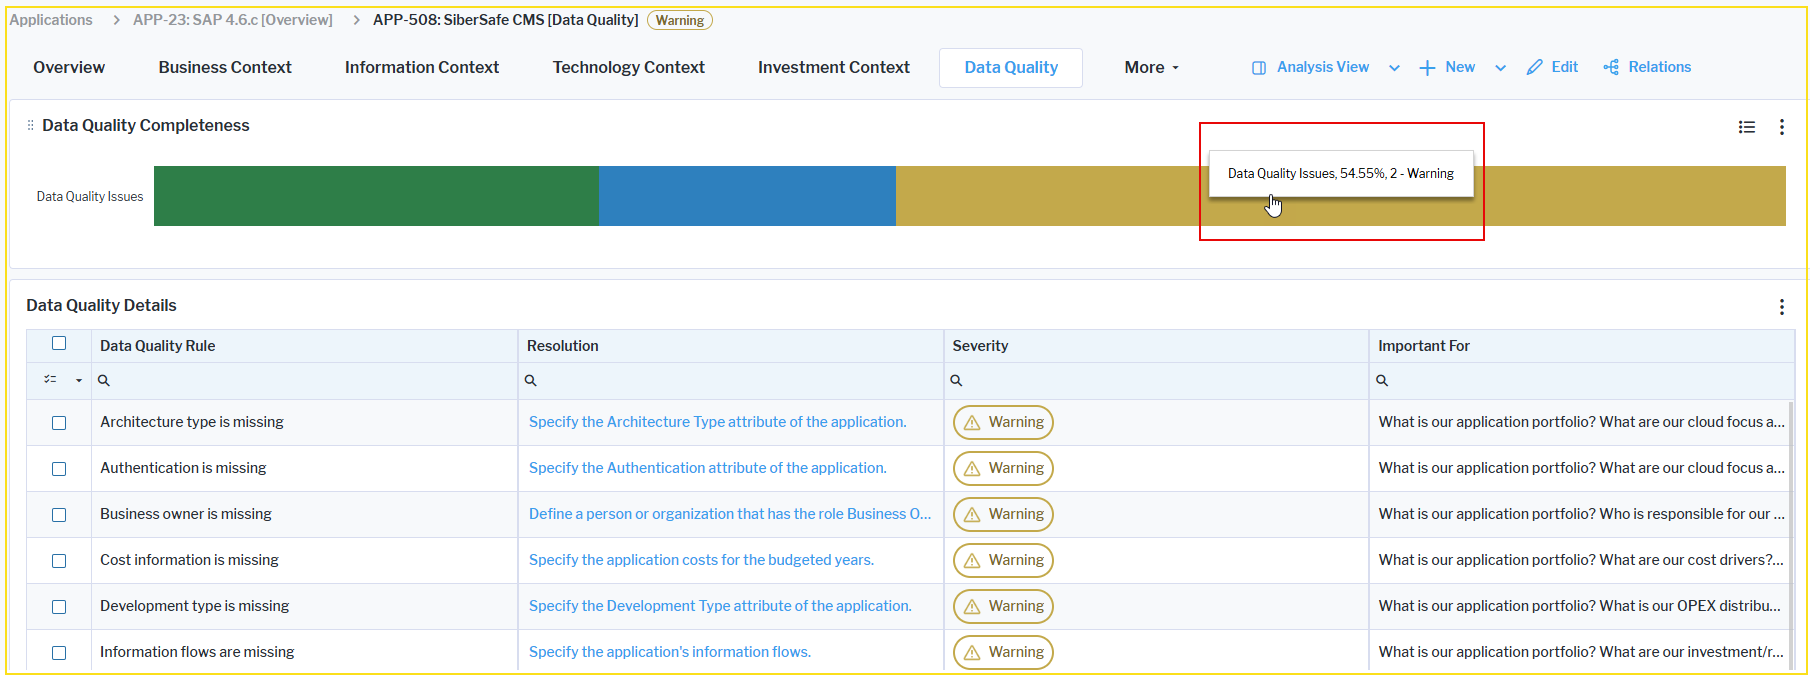
The Data Quality Completeness report on the Data Quality page in an asset's content area has been enhanced to make key information easier to understand and faster to interpret. Axis labels in the bar chart have been improved for greater clarity, and the chart tooltip now is easier to understand. The tooltip shows the percentage of all data quality issues represented by the selected severity level of the violation and the name of the severity level ( 1-Hint, 2-Warning, 3-Error). These improvements help users quickly assess the distribution and impact of data quality issues.
Improved filter guidance and accessibility
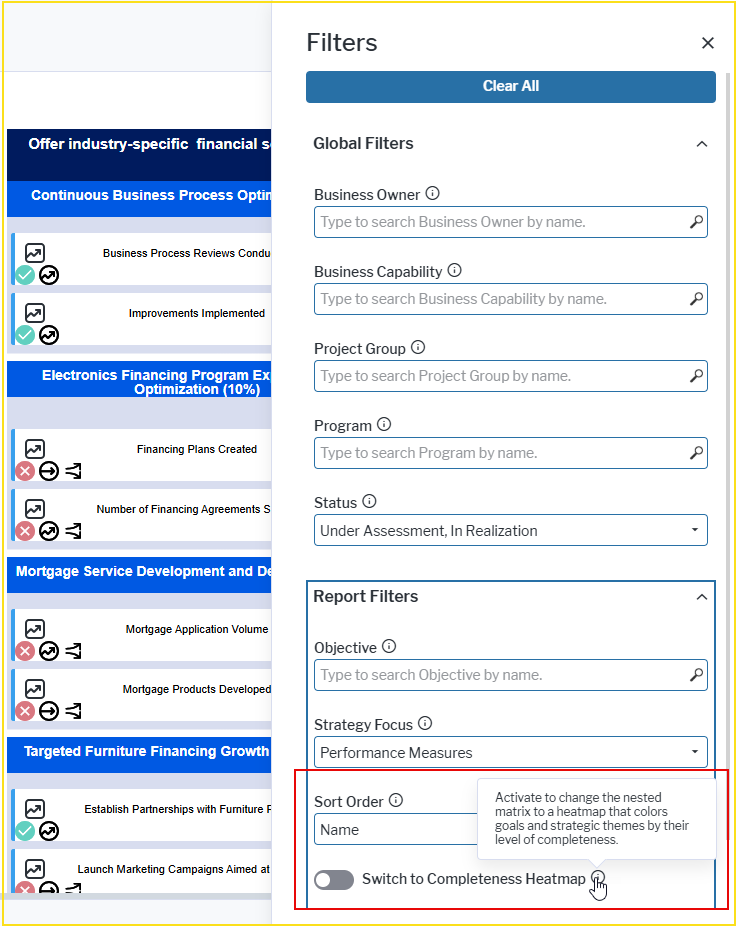
Filter hints have been standardized and enhanced across all business questions, making it easier for users to understand the purpose of each filter, select appropriate values, and navigate the application using screen readers.
Clearer insight into licensed user cases
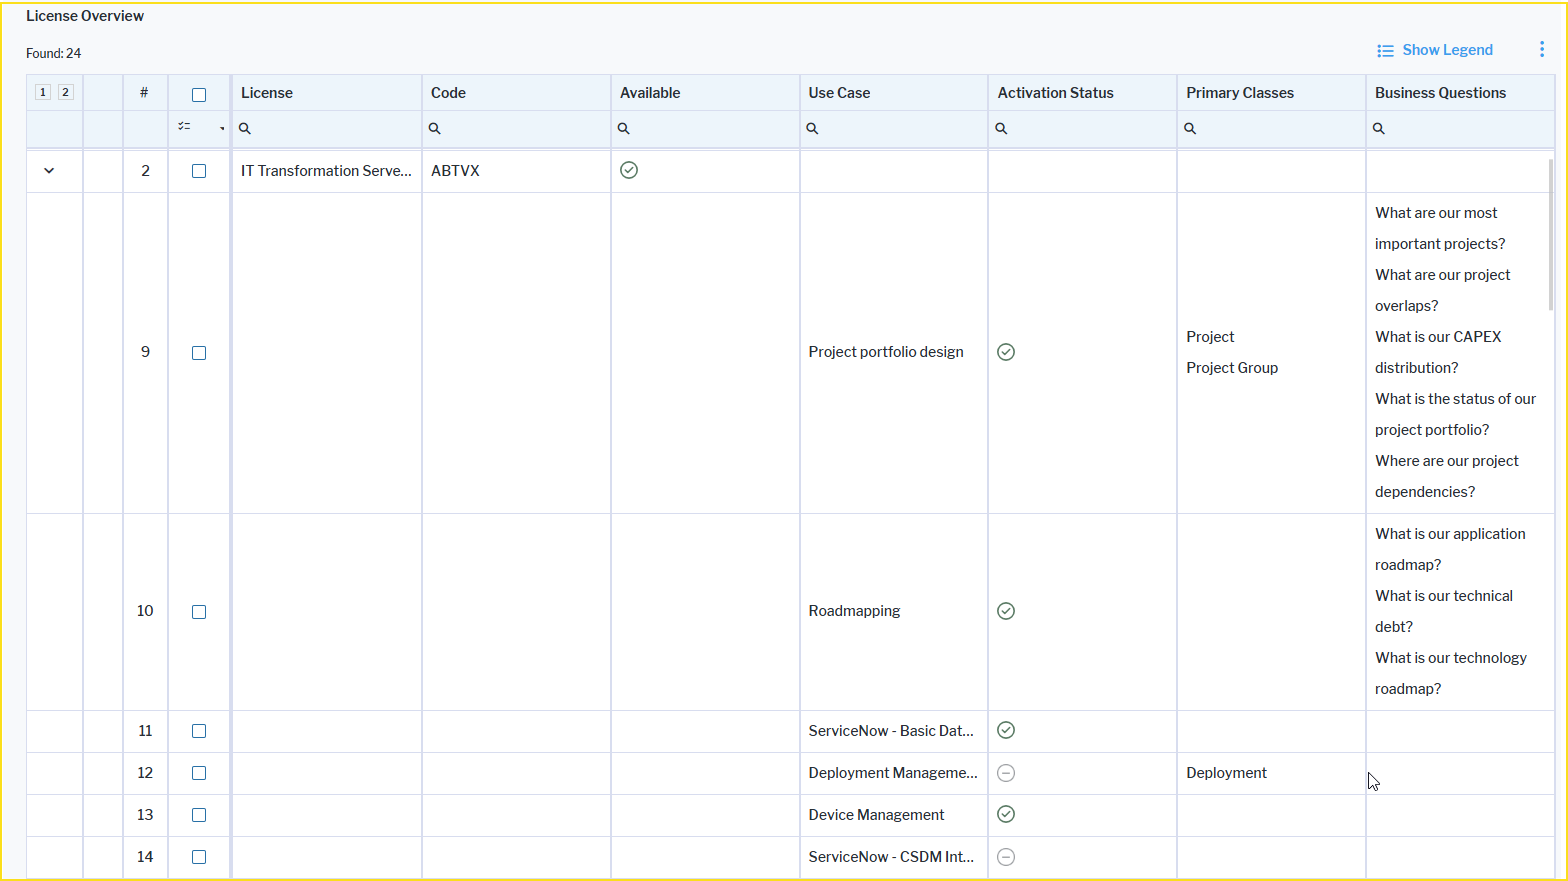
The License Overview available to administrative user profiles has been redesigned to provide clearer visibility into license packages and, more importantly, help users understand which use cases are available, enabled, or still under development. The former Active column has been renamed Activation Status and now uses intuitive icons to indicate the status of each use case: Enabled (green check), Disabled (grey dash), or Under Construction (tool icon). This makes it easier to identify at a glance which capabilities are available for use within the licensed solution. In addition, the Classes column has been renamed Primary Classes to clarify that these key classes are affected when a use case is deactivated.
Improved performance for administrative reports
The reports available to administrative users via the Portfolio Admin user profile have been revised to improve performance. Query execution has been optimized throughout the reporting framework, with particular focus on data usage reports that process large volumes of personal data. All administrative reports have been reviewed, optimized where applicable, and validated against multiple database configurations to ensure improved responsiveness and scalability.