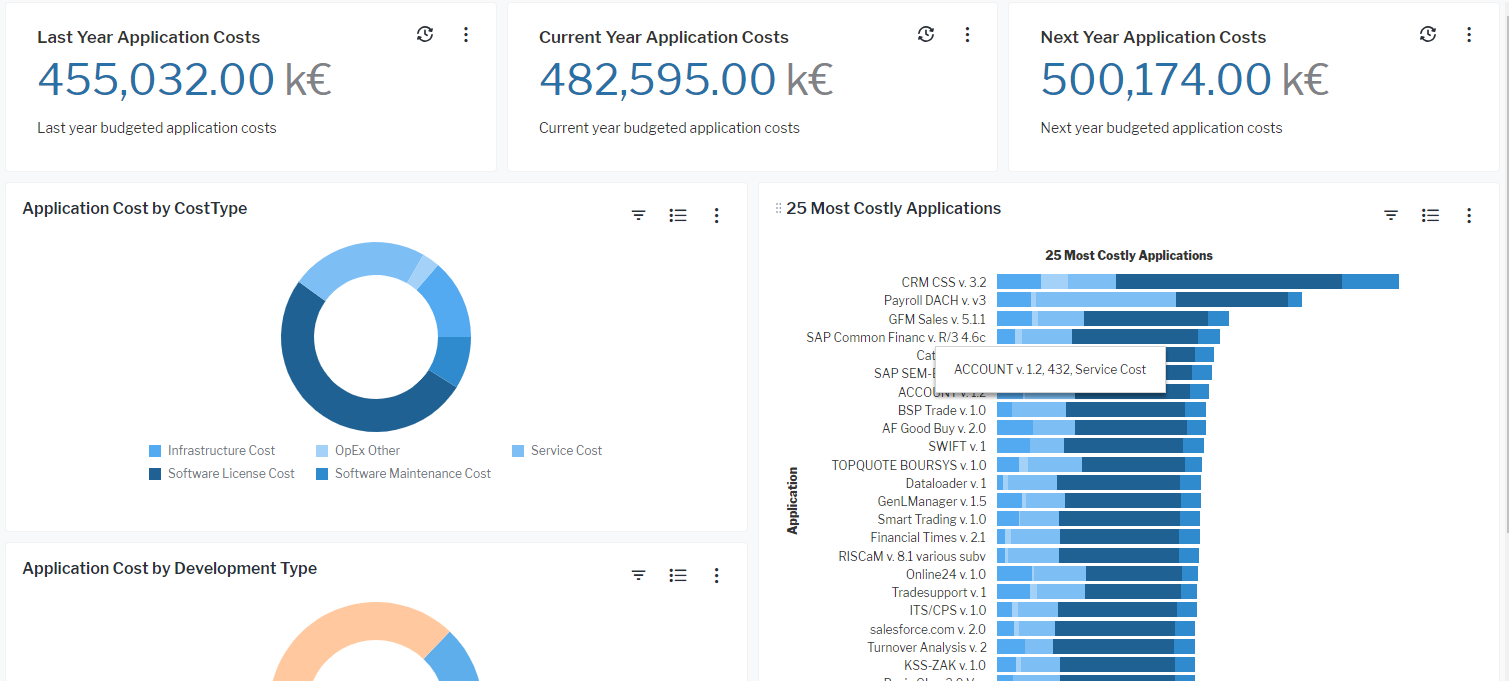
What is our OPEX distribution?
-
Use the method that is most convenient for you:
- In the left navigation panel, click Home. In the content area, go to the Business Questions page and click the tile for What is our OPEX distribution?
- In the left navigation panel, enter What is our OPEX distribution? in the Search Navigation field.
- In the left navigation panel, expand the sections Business Questions and Transparency and click What is our OPEX distribution?

The business question What is our OPEX distribution? provides an overview of operational cost drivers. The analytics allow you to identify the most costly applications. Review the cost break down according to cost types and development types. This business question highlights your company's cost evolution over time and enables a what-if analysis to understand the financial results of rationalization activities.
The following analytics are available to help you understand and manage your operational expenditures. By assessing the details of the following views you can consider whether your applications are in budget. Go to Filter > and set filters for each view to understand applications costs for business owner organizations, business capabilities , and various application groups. Select either Spent Budget or Planned Budget in the Cost Dimension field to show the current or future operational costs for your company's applications.
Application Cost by Cost Type: Shows the cost types and the percentage of the spent or planned budget for the current year that is consumed by each cost type. Point to a doughnut slice to view a tooltip with the percent of budget consumed by the cost type.
Application Cost by Development Type: Shows the development types and the percentage of the spent or planned budget for the current year that is consumed by each development type. Development types include:
- Bespoke: The application was created specifically to address a unique use case.
- COTS - Configured: A commercial off-the-shelf application that has been configured or supports configuration to fulfill the requirements of the enterprise and is fully supported and upgrade-stable.
- COTS - Customized: A commercial off-the-shelf application that is customized or contains organization-specific code/programming to suit the requirements of the enterprise.
- Unknown: The application development type has not yet been assessed.
25 Most Costly Applications: Shows the 25 most costly applications based on the planned budgets vs. the spent budget. The bar chart shows a breakdown of each application based on its cost types so that you can understand which applications have cost your company the most and why.