Define the data you want to see
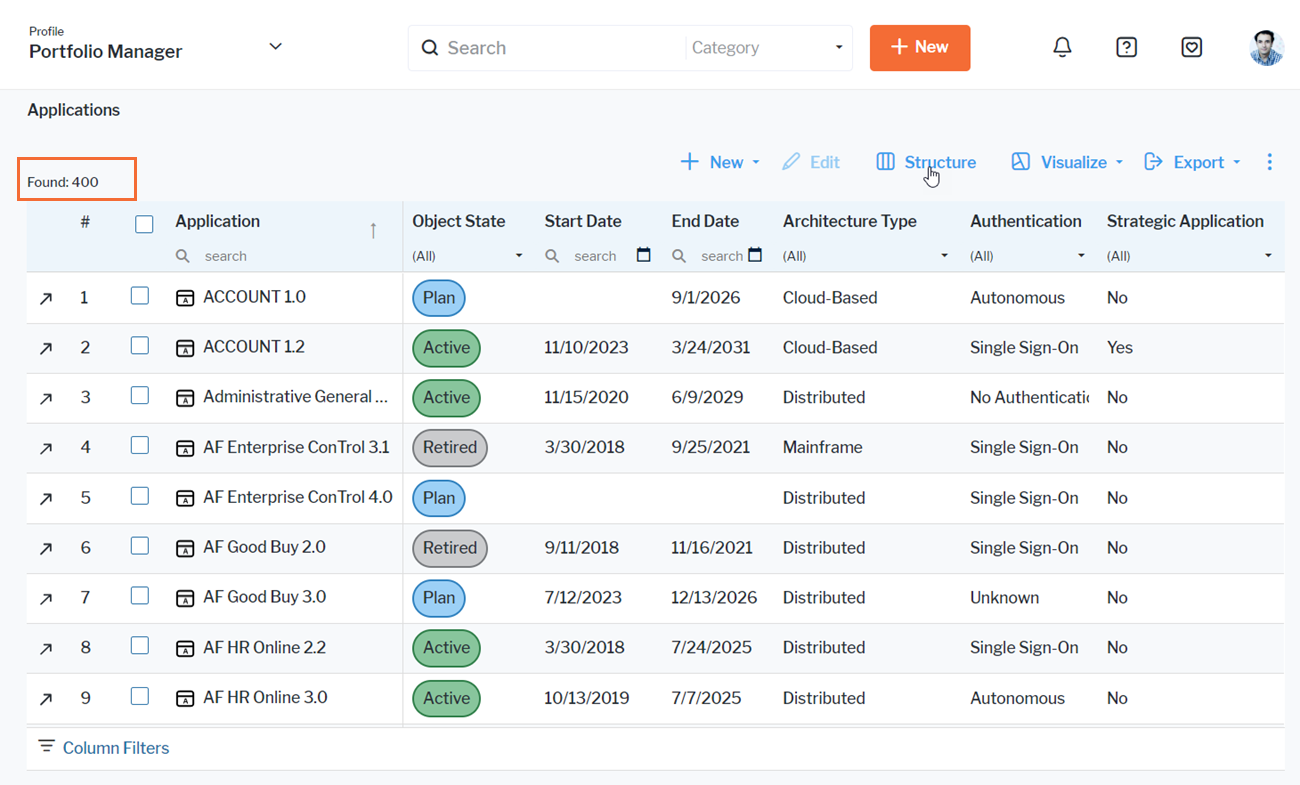
The data table is the default view when you first open the data workbench. The data table is where you can see all of your data, specify the columns of information you want to display, and define filters to limit the dataset to the assets you are most interested in. All objects that you have permissions for will be displayed in the data workbench the first time you go to it. Each column in the data workbench represents either standard attributes, indicator types including the indicator icon and semantic value, roles showing the name of the person  or organization
  fulfilling the role, or generic attributes.
If the dataset is large or you need to work with a subset of data, you can set filters to reduce the number of assets to only those that are relevant for your current information needs.

The column structure and filter settings are persistent and will be displayed when you return to the data workbench, but you can change them at any time. Click  > Switch to Default View to return to the default settings.
In addition to the data table where you can edit, you can display your data in many different graphic visualizations including bar charts, line charts, doughnut charts, Gantt charts (timelines), and matrix reports. Click the Visualize button to select Data Table or any other visualization to display your data. Click for details about how to work with the graphic visualizations in the data workbench.